Shape model behavior
Inspect the model with visualization tools
Use token probabilities, alternatives, embeddings, and attention views to turn a surprising output into a concrete question.
Choose one generated answer that surprised you. Open the app’s X-ray or inspection view for that generation.
Find a token where the model had several plausible alternatives. Record the chosen token, its probability, and the next two alternatives. The X-ray reports probabilities after the active temperature and filters, so save those settings too.
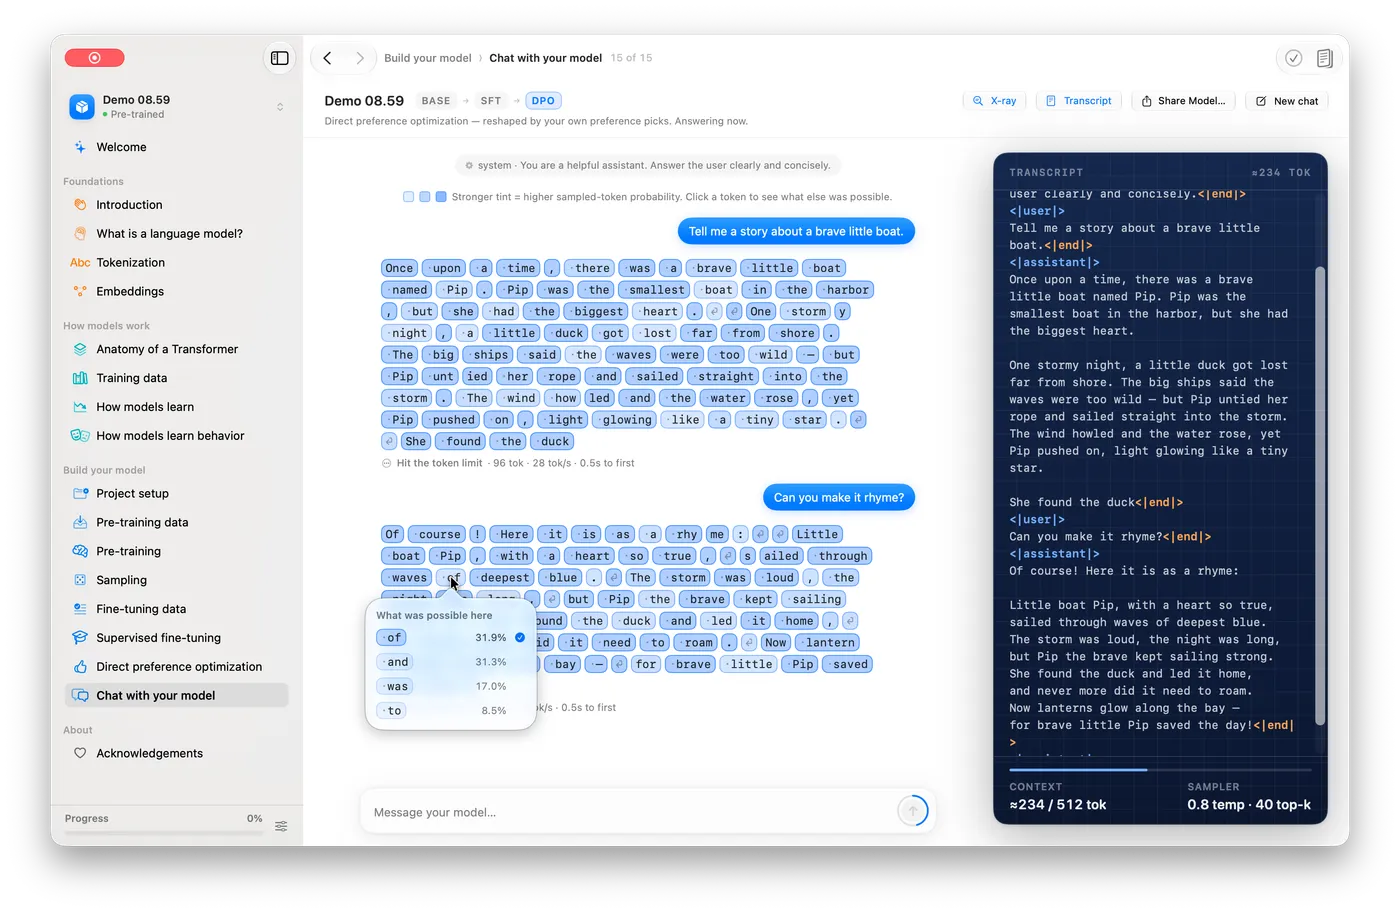
You might see the model pick " door" at 0.42 while " room" sits at 0.31 and " hall" at 0.18. Write those three numbers next to the prompt token that preceded them.
Ask a counterfactual question: what changes if one prompt token changes? Run both prompts with the same checkpoint and sampling controls, then compare the distributions at the relevant position.
Look back at the prompt and ask which context tokens might have influenced that choice. Use the attention view when available, but do not treat one bright attention weight as a complete explanation of the model.
Attention weights show how one operation combined positions. They do not include every residual path, feed-forward transformation, or later layer that contributed to the final logits.
Use the embedding map to inspect one important token from the prompt. Remember that its two-dimensional position is a projection.
Write a narrow observation: “At this position, the model gave these alternatives similar probability.” Do not claim the visualization reveals a human-like thought process.
Use visualizations to propose tests, not finish explanations. If you suspect the model relies on a name in the prompt, remove or replace that name and measure the output distribution again.
Save the checkpoint, exact prompt tokens, layer or head selection, and visualization settings. A screenshot without those details is difficult to reproduce.
If attention highlights the word Mia strongly, replace Mia with Leo and rerun. When the distribution at the next token barely moves, the name may matter less than you thought from the heatmap alone.
Try this on your weakest sample, not your best one. Surprising failures usually teach more than a polished success.
Lesson completed