Working with the DevTools Console and the Console API
By Flavio Copes
Learn how to use the browser DevTools console and the Console API, from console.log formatting to console.count, console.trace and timing your code.
The browser DevTools console lets you run JavaScript and inspect messages from the page. The Console API gives your code methods such as console.log(), console.error(), and console.table().
Console behavior and DevTools shortcuts can differ between browsers. The common methods are documented in the MDN Console API reference.
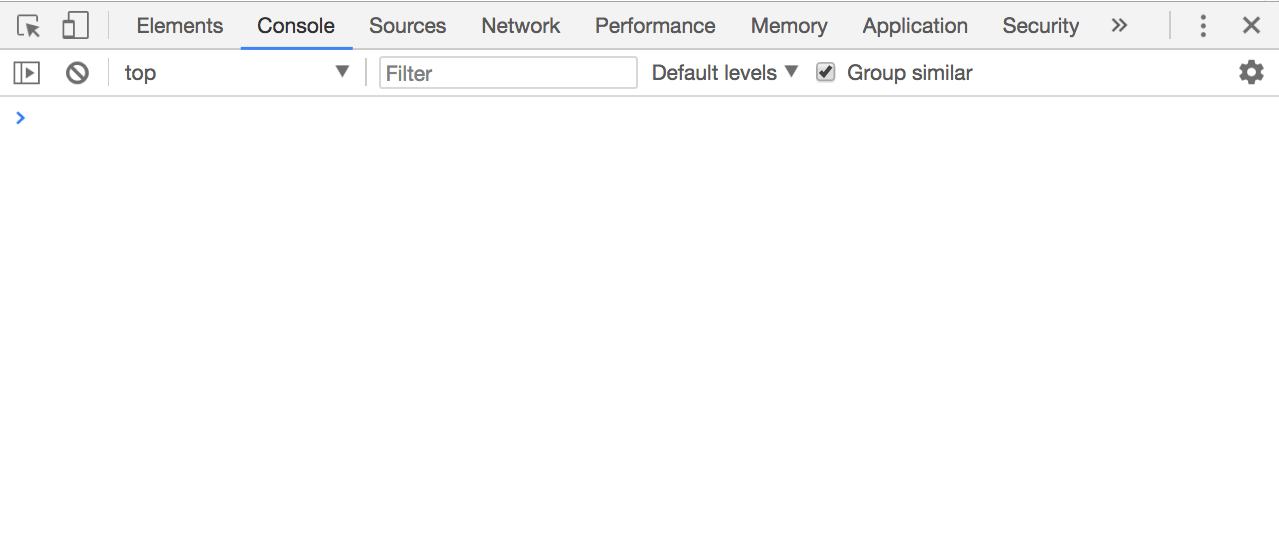
- Overview of the console
- Use console.log formatting
- Clear the console
- Counting elements
- Log more complex objects
- Logging different error levels
- Preserve logs during navigation
- Grouping console messages
- Print the stack trace
- Calculate the time spent
- Generate a CPU profile
Overview of the console
The console toolbar lets you clear messages and filter by text or log level. The exact buttons and keyboard shortcuts depend on the browser.
You can also choose to hide network-generated messages, and just focus on the JavaScript log messages.
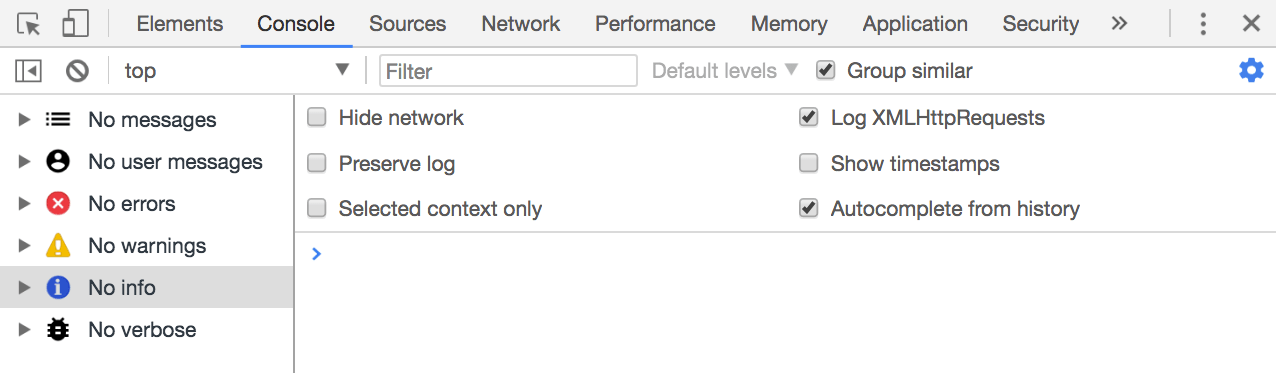
The console is not just a place to see messages. You can also run JavaScript, inspect the DOM, and call Web APIs.
Let’s type our first message. Notice the >, let’s click there and type
console.log('test')The console acts as a REPL, which means read–eval–print loop. In short, it interprets our JavaScript code and prints something.
Use console.log formatting
As you see, console.log('test') prints ‘test’ in the Console.
Using console.log in your JavaScript code can help you debug for example by printing static strings, but you can also pass it a variable, which can be a JavaScript native type (for example an integer) or an object.
You can pass multiple variables to console.log, for example:
console.log('test1', 'test2')We can also format pretty phrases by passing variables and a format specifier.
For example:
console.log('My %s has %d years', 'cat', 2)%sformat a variable as a string%dor%iformat a variable as an integer%fformat a variable as a floating point number%ocan be used to print a DOM Element%Oused to print an object representation
Example:
console.log('%o, %O', document.body, document.body)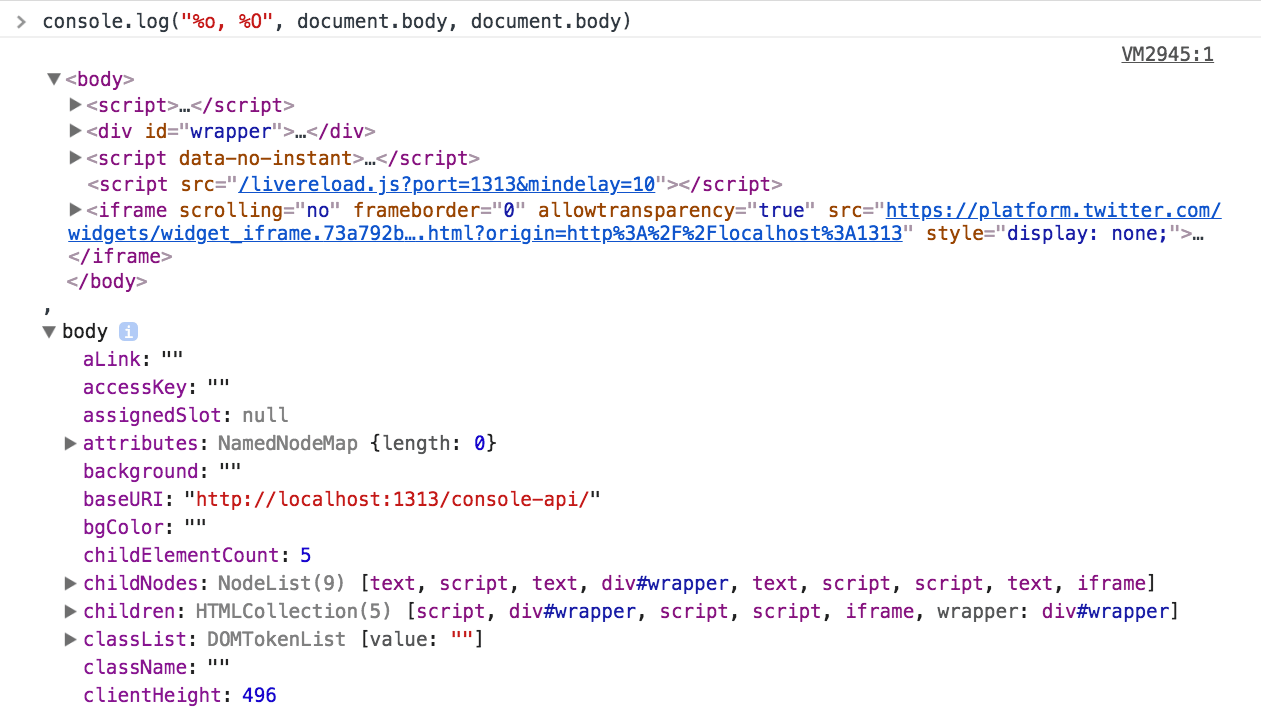
Another useful format specifier is %c, which allows to pass CSS to format a string. For example:
console.log(
  '%c My %s has %d years',
  'color: yellow; background:black; font-size: 16pt',
  'cat',
  2,
)
Clear the console
The portable way to clear messages from JavaScript is:
console.clear()You can also use the clear button or keyboard shortcut in DevTools. Those shortcuts vary between browsers and operating systems.
Counting elements
console.count() is a handy method.
Take this code:
const x = 1
const y = 2
const z = 3
console.count(
  'The value of x is ' + x + ' and has been checked .. how many times?',
)
console.count(
  'The value of x is ' + x + ' and has been checked .. how many times?',
)
console.count(
  'The value of y is ' + y + ' and has been checked .. how many times?',
)
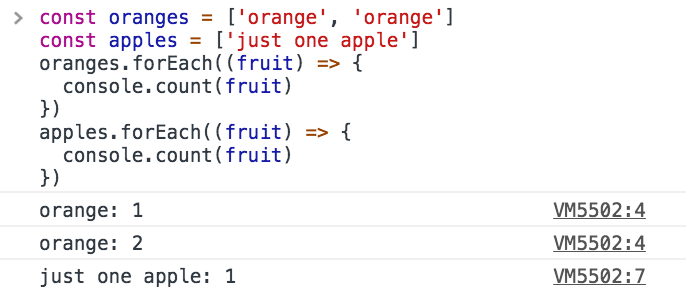
console.count() counts how many times it is called with the same label:
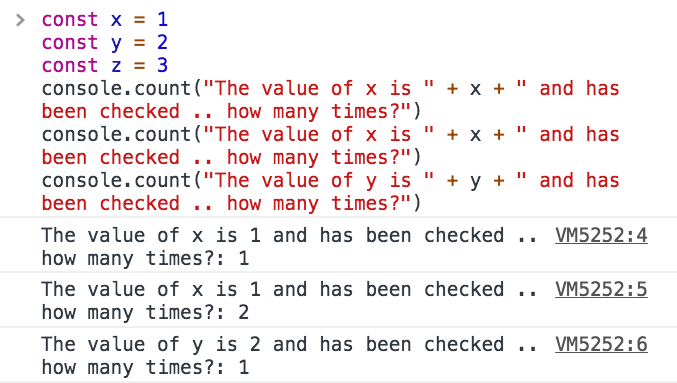
You can just count apples and oranges:
const oranges = ['orange', 'orange']
const apples = ['just one apple']
oranges.forEach((fruit) => {
  console.count(fruit)
})
apples.forEach((fruit) => {
  console.count(fruit)
})
console.countReset() clears a label’s count so the next console.count() call starts from 1 again:
console.count('banana')
console.count('banana')
console.countReset('banana')
console.count('banana') //banana: 1
console.assert() logs only when a condition is falsy. Pass the assertion first, then the message (or values) to print on failure:
const age = 15
console.assert(age >= 18, 'age must be 18+', age)
When the check passes, nothing is printed. When it fails, you get an assertion error in the console.
Log more complex objects
You can pass objects and arrays to console.log(). The browser usually shows an expandable view.
For example try
console.log([1, 2])Another option to print objects is to use console.dir:
console.dir([1, 2])This method shows an interactive list of the object’s properties.
The same thing that console.dir outputs is achievable by doing
console.log('%O', [1, 2])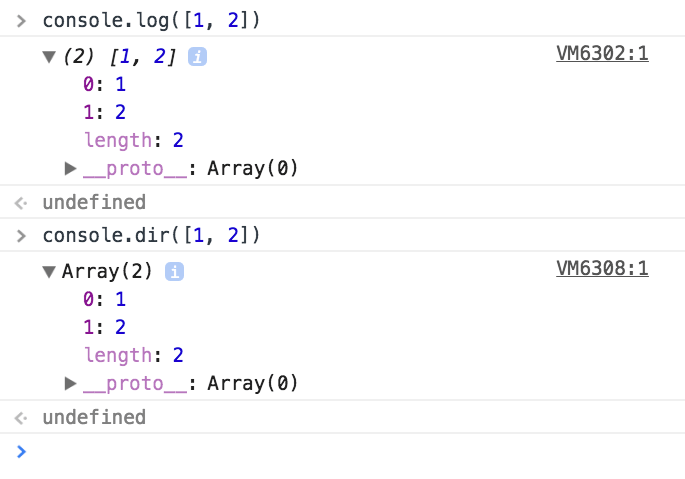
Use whichever view makes the value easier to inspect.
Browsers can read object properties lazily. If you change an object after logging it, expanding the old log entry can show the newer values. Clone the object first when you need a snapshot:
const settings = { theme: 'dark' }
console.log(structuredClone(settings))
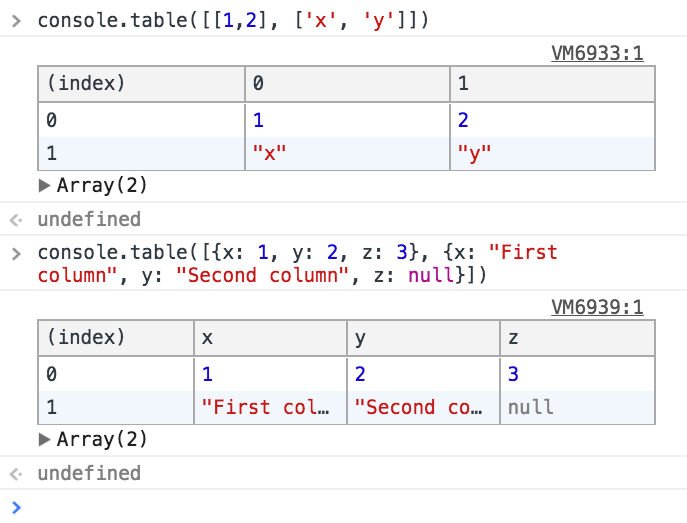
Another function is console.table() which prints a nice table.
We just need to pass it an array of elements, and it will print each array item in a new row.
For example
console.table([
  [1, 2],
  ['x', 'y'],
])
or you can also set column names, by passing instead of an array, an Object Literal, so it will use the object property as the column name
console.table([
  { x: 1, y: 2, z: 3 },
  { x: 'First column', y: 'Second column', z: null },
])
console.table can also be more powerful and if you pass it an object literal that in turn contains an object, and you pass an array with the column names, it will print a table with the row indexes taken from the object literal. For example:
const shoppingCart = {}
shoppingCart.firstItem = { color: 'black', size: 'L' }
shoppingCart.secondItem = { color: 'red', size: 'L' }
shoppingCart.thirdItem = { color: 'white', size: 'M' }
console.table(shoppingCart, ['color', 'size'])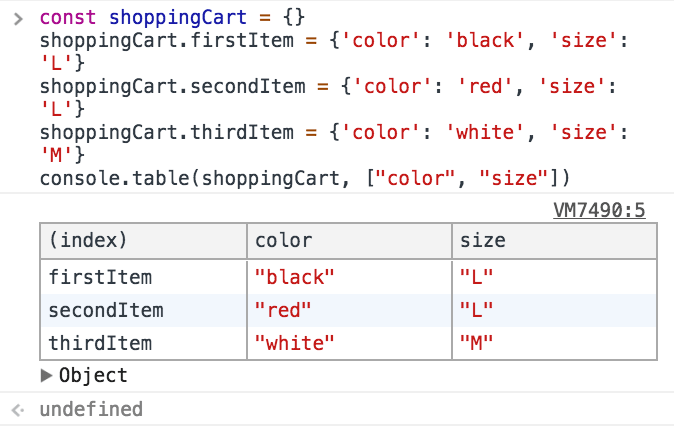
Logging different error levels
As we saw, console.log() is useful for general messages.
We’ll now discover three more handy methods that will help us debug, because they implicitly indicate various levels of error.
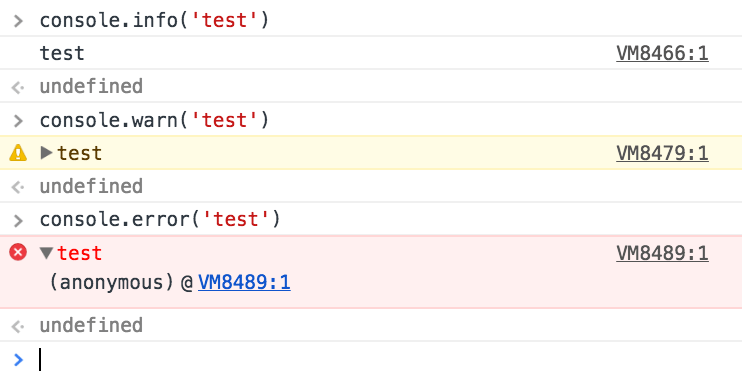
Use console.info() for information and console.warn() for warnings.
If you activate the Console filtering toolbar, you can see that the Console allows you to filter messages based on the type, so it’s really convenient to differentiate messages because for example if we now click ‘Warnings’, all the printed messages that are not warnings will be hidden.
Use console.error() for errors. Browsers usually highlight it and may include a stack trace, but the exact display differs.
Preserve logs during navigation
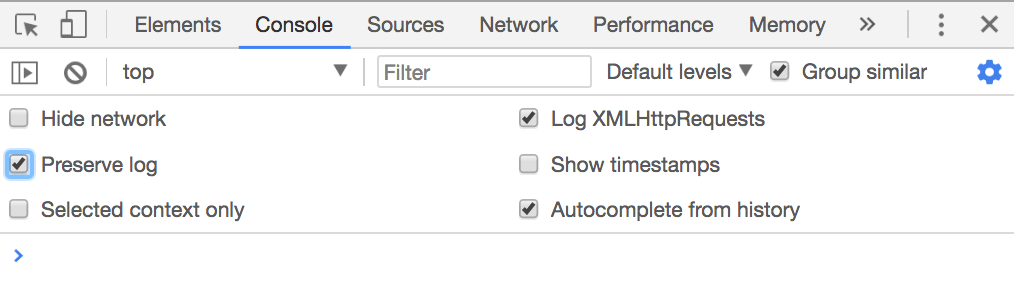
Console messages are cleared on every page navigation, unless you check the Preserve log in the console settings:
Grouping console messages
The Console messages can grow in size and the noise when you’re trying to debug an error can be overwhelming.
To limit this problem the Console API offers a handy feature: Grouping the Console messages.
Let’s do an example first.
console.group('Testing the location')
console.log('Location hash', location.hash)
console.log('Location hostname', location.hostname)
console.log('Location protocol', location.protocol)
console.groupEnd()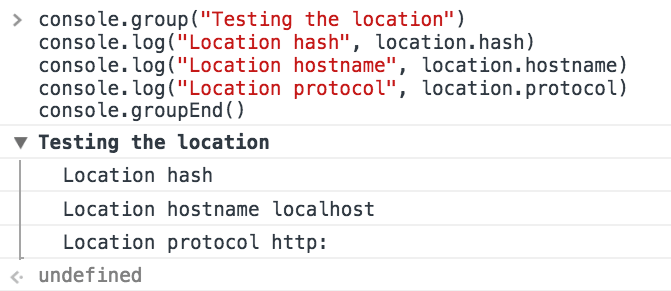
As you can see the Console creates a group, and there we have the Log messages.
You can do the same, but output a collapsed message that you can open on demand, to further limit the noise:
console.groupCollapsed('Testing the location')
console.log('Location hash', location.hash)
console.log('Location hostname', location.hostname)
console.log('Location protocol', location.protocol)
console.groupEnd()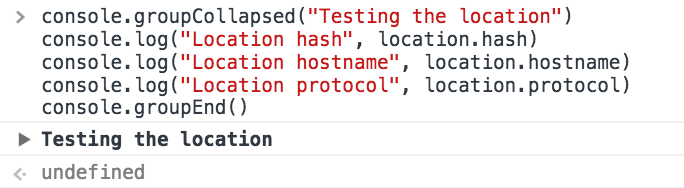
The nice thing is that those groups can be nested, so you can end up doing
console.group('Main')
console.log('Test')
console.group('1')
console.log('1 text')
console.group('1a')
console.log('1a text')
console.groupEnd()
console.groupCollapsed('1b')
console.log('1b text')
console.groupEnd()
console.groupEnd()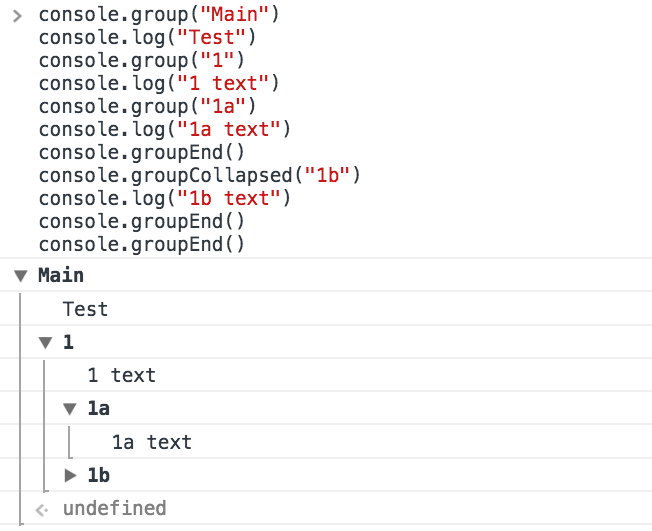
Print the stack trace
There might be cases where it’s useful to print the call stack trace of a function, maybe to answer the question how did you reach that part of code?
You can do so using console.trace():
const function2 = () => console.trace()
const function1 = () => function2()
function1()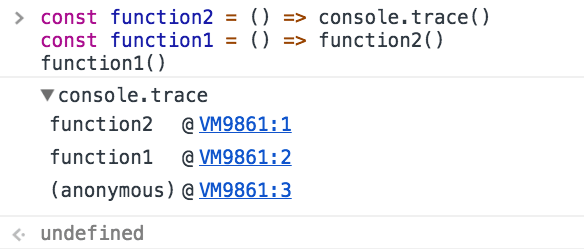
Calculate the time spent
You can easily calculate how much time a function takes to run, using time() and timeEnd()
const doSomething = () => console.log('test')
const measureDoingSomething = () => {
  console.time('doSomething()')
  //do something, and measure the time it takes
  doSomething()
  console.timeEnd('doSomething()')
}
measureDoingSomething()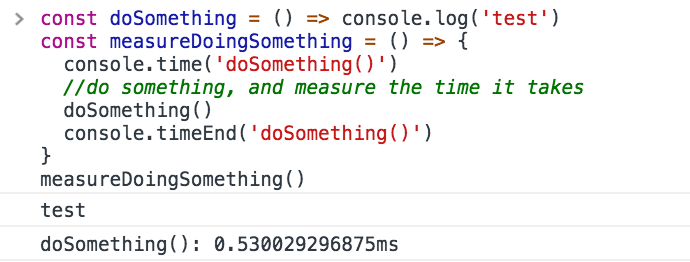
console.timeLog() prints an intermediate timing for a running timer without stopping it:
console.time('load')
// first part of the work
console.timeLog('load') //load: 12.345ms
// more work
console.timeEnd('load')
Use timeLog() when you want checkpoints. Use timeEnd() when the measurement is done.
Generate a CPU profile
Some browsers let you start a CPU profile from the console.
You can wrap the code between console.profile() and console.profileEnd():
const doSomething = () => console.log('test')
const measureDoingSomething = () => {
  console.profile('doSomething()')
  //do something, and measure its performance
  doSomething()
  console.profileEnd()
}
measureDoingSomething()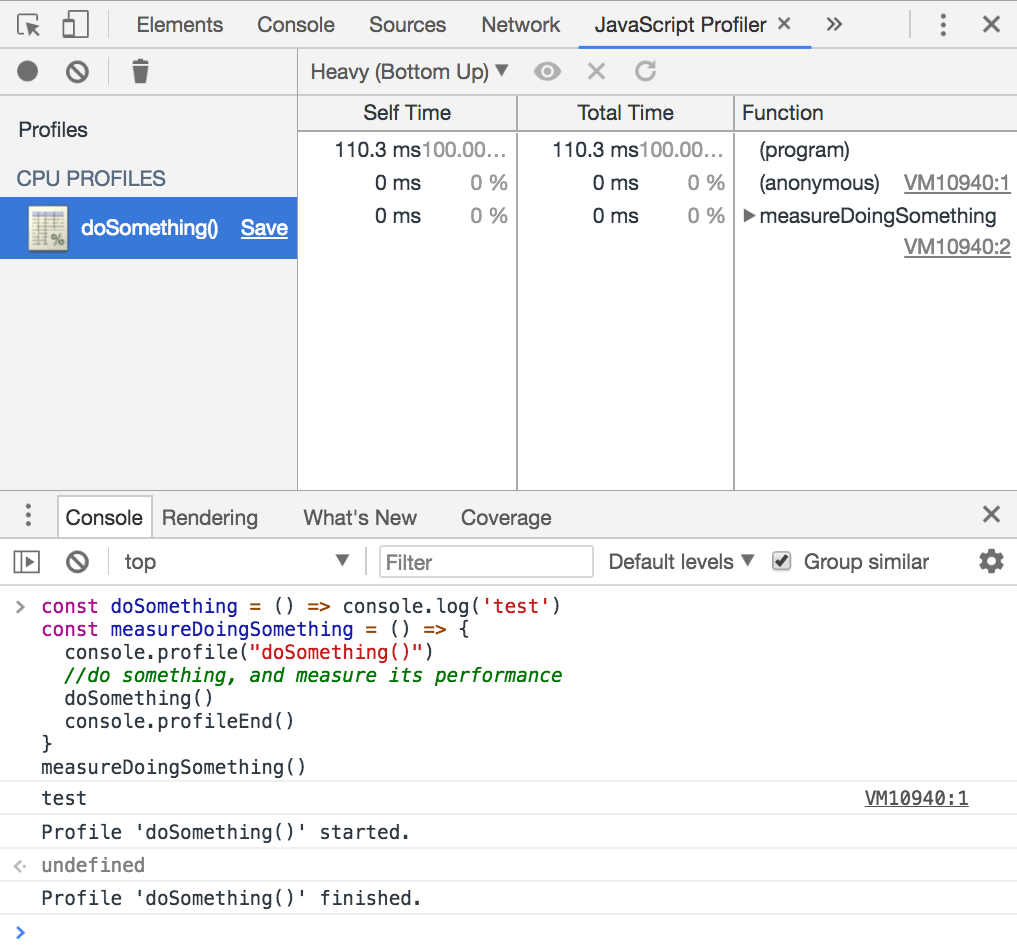
These methods are non-standard and are not available in every runtime. Use the browser’s Performance panel when you need a portable profiling workflow.
Want me to talk about your product? You can sponsor this site.
Related posts about platform: