Getting started with Go CPU and memory profiling
By Flavio Copes
Get started with CPU and memory profiling in Go using the pkg/profile package, a one-line defer in main(), then analyze the result with go tool pprof.
The Go ecosystem provides a very easy way to profile your applications.
I’ll explain profiling using a package by Dave Cheney which makes programs very easy to debug, by adding a one-liner to our main().
All you need to get started is follow these easy steps. I checked them with Go 1.27 and github.com/pkg/profile v1.7.
CPU Profiling
Step #1: add github.com/pkg/profile to your module
Inside your project (run go mod init yourproject first if it’s not a module yet), run:
go get github.com/pkg/profileand you’re done.
Step #2: add profiling into the main() function of your command
package main

import (
    //...
	"github.com/pkg/profile"
)

func main() {
	// CPU profiling by default
	defer profile.Start().Stop()

    //...
}
Step #3: build and run your program
This will generate a *.pprof file in a temp folder, and tell you where it’s located (will be needed later)
2017/08/03 14:26:28 profile: cpu profiling enabled, /var/...../cpu.pprofStep #4: install graphviz if you don’t have it installed yet
This is used to generate the graph on a pdf.
On a Mac, it’s a simple brew install graphviz. Refer to https://www.graphviz.org for other platforms.
Step #5: run go tool pprof
Pass your binary location, and the location of the cpu.pprof file as returned when running your program.
You can generate the analysis in various formats. The PDF one is pretty amazing:
go tool pprof --pdf ~/go/bin/yourbinary /var/path/to/cpu.pprof > file.pdf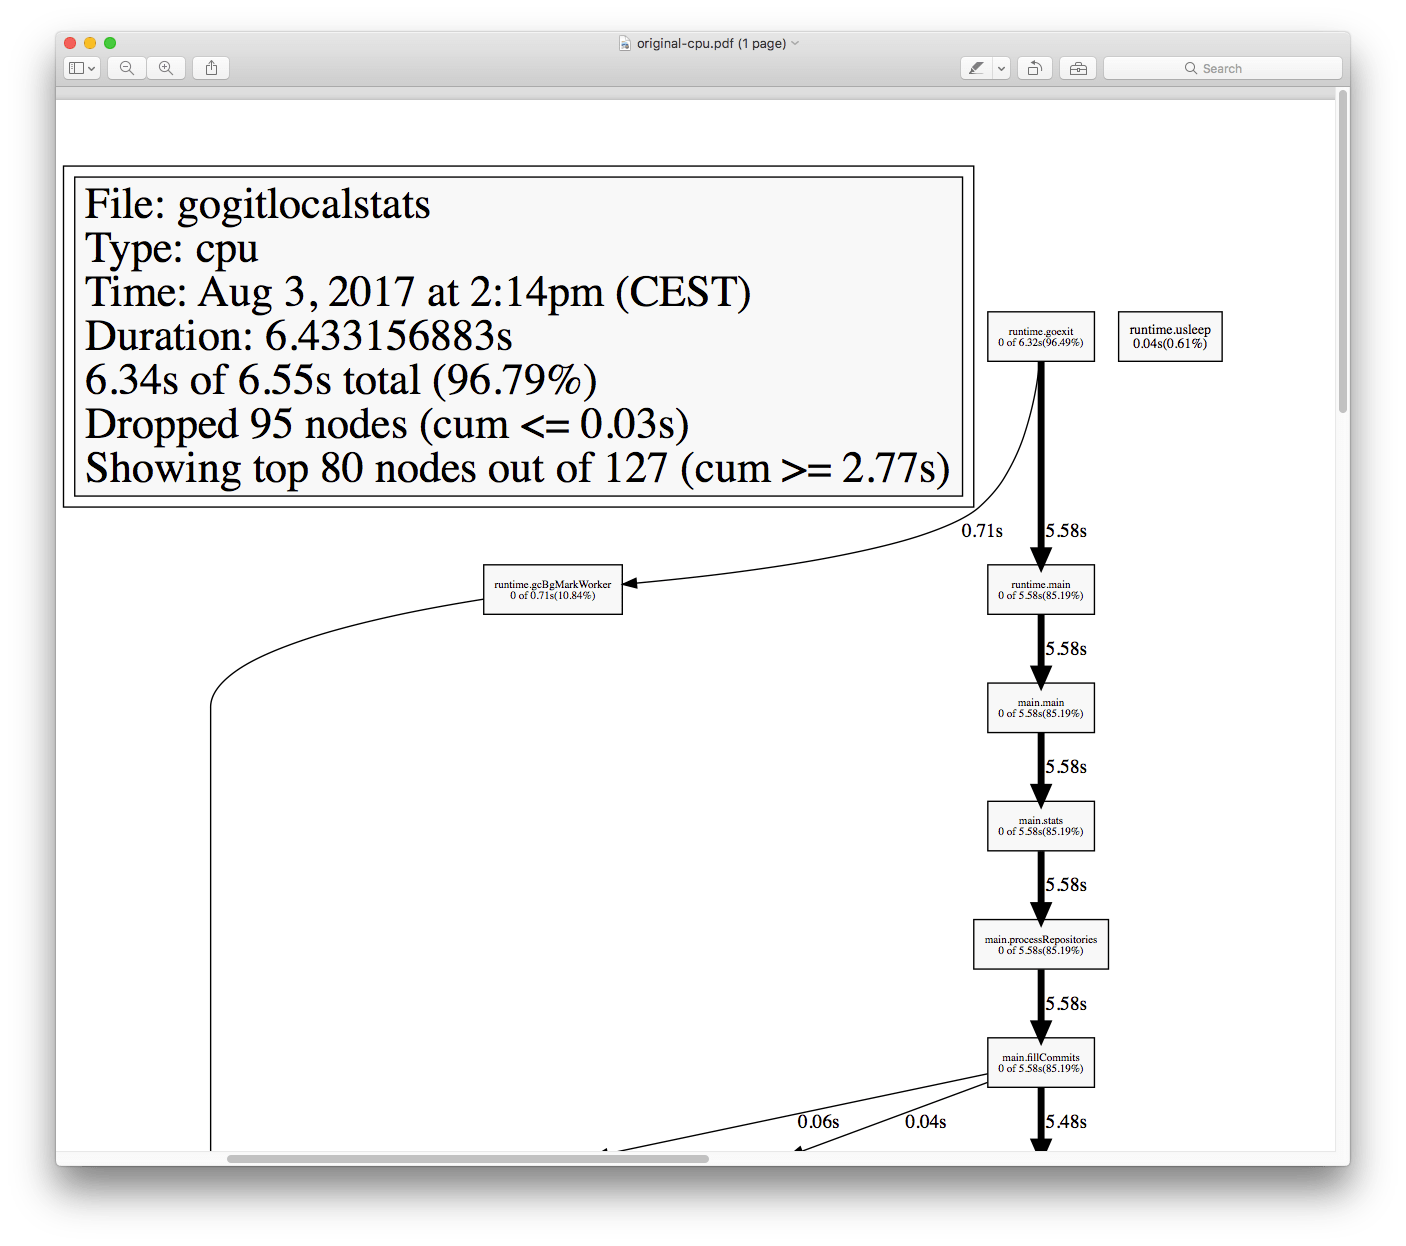
You can generate other kind of visualizations as well, e.g. plain text:
go tool pprof --text ~/go/bin/yourbinary /var/path/to/cpu.pprof > file.txtMemory profiling
Memory profiling is essentially the same as CPU profiling, but instead of using the default configuration for profile.Start(), we pass a profile.MemProfile flag:
defer profile.Start(profile.MemProfile).Stop()thus the code becomes
package main

import (
    //...
	"github.com/pkg/profile"
)

func main() {
	// Memory profiling
	defer profile.Start(profile.MemProfile).Stop()

    //...
}
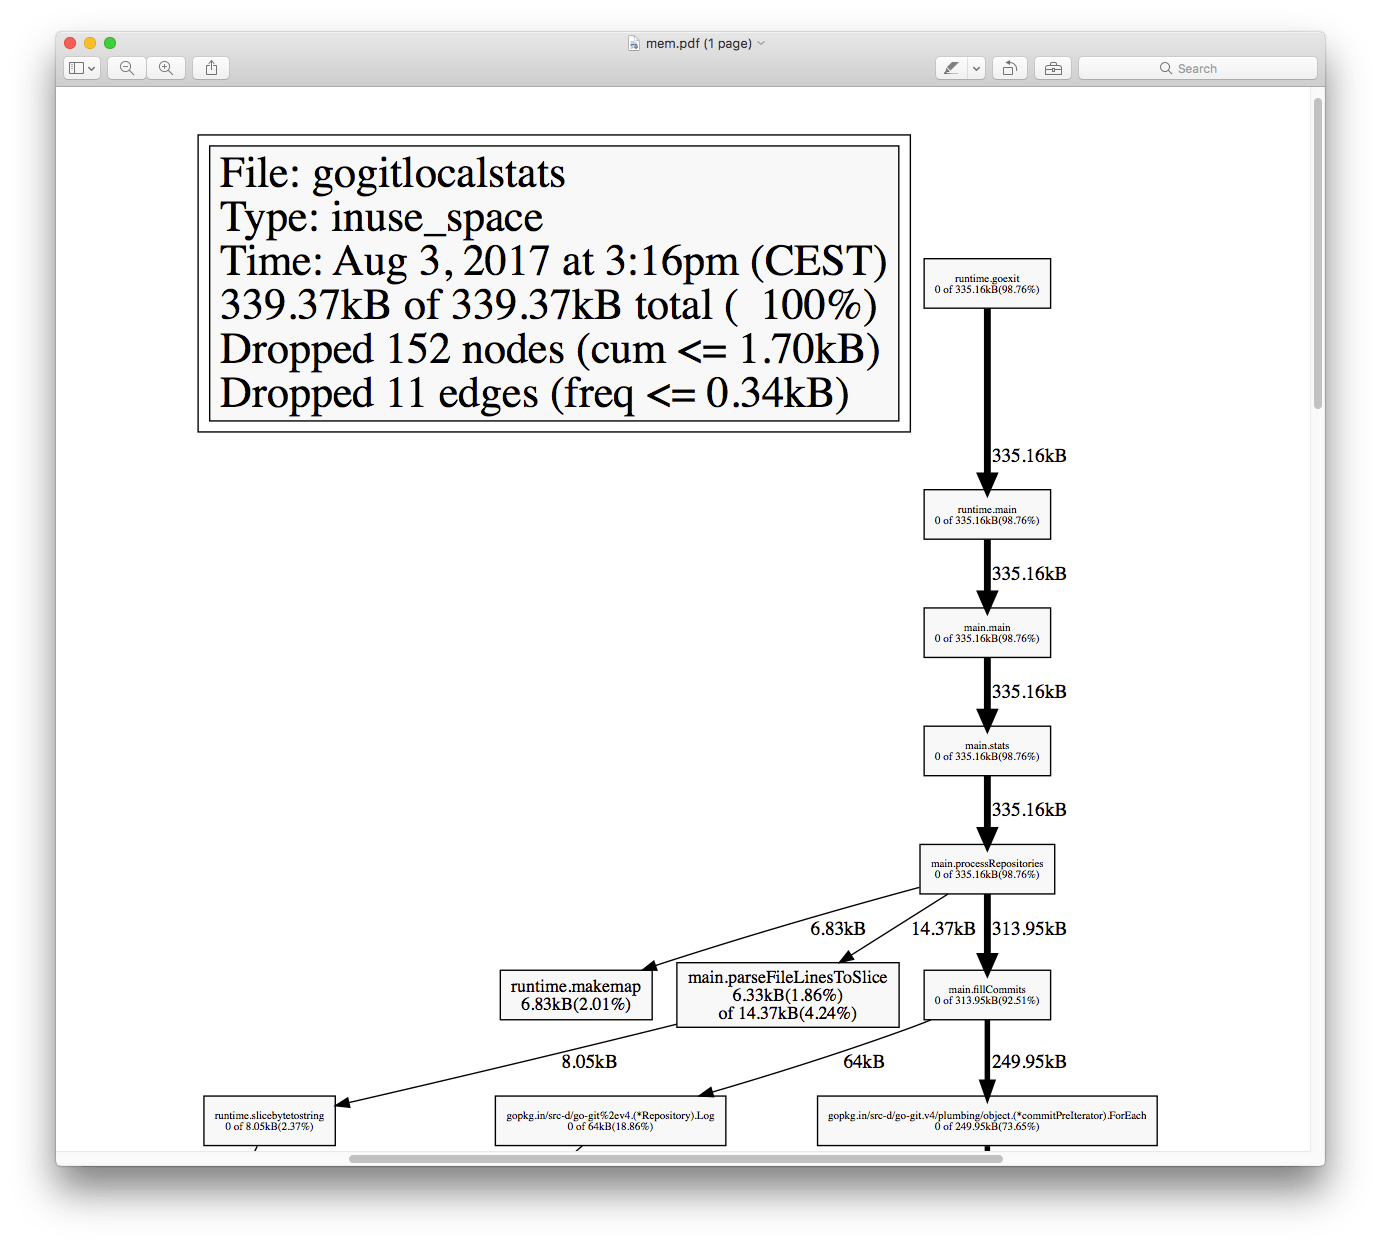
and when running the program, it will generate a mem.pprof file instead of cpu.pprof.
Read more about profiling Go apps
This is just a start. Read more at:
- https://go.dev/blog/pprof
- Lower level: https://pkg.go.dev/runtime/pprof
- More options for advanced usage of
github.com/pkg/profilehttps://pkg.go.dev/github.com/pkg/profile
Want me to talk about your product? You can sponsor this site.