Debugging Go with VS Code and Delve
By Flavio Copes
Learn how to debug Go in VS Code with Delve: install the Go extension and Delve via Homebrew, then start debugging with the launch.json config by pressing F5.
VS Code from Microsoft is my favorite code editor. I used tons of editors in the last 20 years and this is the best by far.
It’s Open Source, fast, even on my not-so-recent MacBook Pro, it never crashed in the middle of something, it’s hackable and yet works great out of the box.
It’s all amazing, but how do you debug Go programs? You might think you need a heavy IDE for that, but that’s not true. It’s super easy, with Delve, made by Derek Parker.
First install the official Go extension for VS Code (golang.go, from the Go Team at Google), and make sure Go / GOPATH is set up for the extension.
Once this is installed, on Linux/Win you can run Go: Install/Update Tools and pick Delve. On a Mac, install Delve with Homebrew:
brew install delve(As I update this post, in September 2026, Homebrew ships Delve 1.27.) On any platform you can also install it with the Go toolchain:
go install github.com/go-delve/delve/cmd/dlv@latestOnce you’re done, setup the debugger configuration.
Click the VS Code debug menu and click “Start debugging”, or just press F5.
VS Code puts the debug information in the .vscode/launch.json file in the root of your workspace. The Go extension generates it for you, and the default it creates is enough for local debugging:
{
    "version": "0.2.0",
    "configurations": [
        {
            "name": "Launch Package",
            "type": "go",
            "request": "launch",
            "mode": "auto",
            "program": "${fileDirname}"
        }
    ]
}
Behind the scenes the extension starts Delve in DAP mode (dlv dap), the Debug Adapter Protocol VS Code speaks natively. You don’t have to start dlv yourself or pick a port. If you find an old launch.json around with "port": 2345, "host" and "remotePath" entries, those belong to the legacy adapter and you can delete them.
As per the docs, the mode parameter can be set to:
auto to pick debug or test depending on the file you have open (the default)
debug to compile and debug the current program
test to debug tests (to debug a single test, pass -test.run and the test name in args)
exec to run a pre-built binary specified in program, for example "program": "${workspaceFolder}/mybin"
replay and core to replay an rr recording or open a core dump
Remote debugging is not a launch mode anymore: you start a headless Delve server on the target machine (dlv debug --headless --listen=:2345) and connect to it with a configuration that has "request": "attach" and "mode": "remote" (refer to the official documentation on Debugging).
Having trouble? Check the debugging troubleshooting notes.
Once this is done, Delve is ready to run!
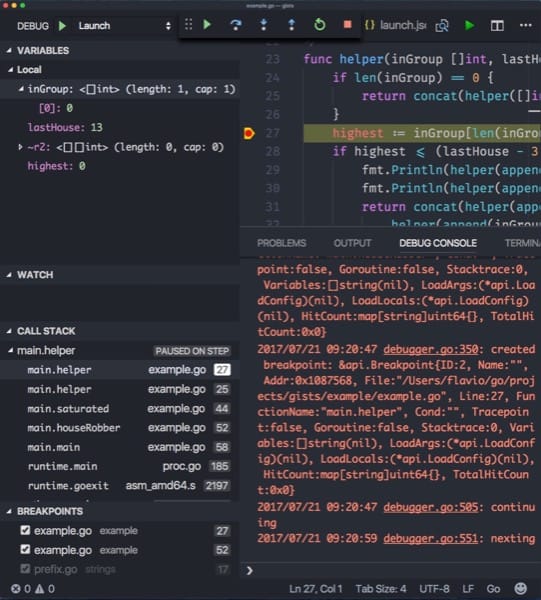
You can see that this is a pretty standard debugger, with local and global variables inspection, the option to watch specific variables, the call stack visualization and breakpoints.
What I especially like about debugging Go, and stepping into lib calls is that the standard library is very clean, well documented and readable, and by debugging you learn a lot of things on how things work internally as well.
Happy debugging!
Want me to talk about your product? You can sponsor this site.