Start running JavaScript
The definitive guide to debugging JavaScript
Learn how to debug JavaScript, from narrowing down where the error comes from and reading the code to using console.log and the browser DevTools debugger.
Debugging is one of those skills that sits at the center of programming.
Sometimes you ship your best work and the program still crashes, runs slow, or prints the wrong value. When that happens, you debug it.
Figuring out where the error could be
Start by asking where the problem lives. Is it the environment, the input, a one-off memory spike, or something that happens on every run?
Those answers point you in the right direction before you open DevTools.
Once you have a suspect area, read that code out loud. I mean actually say it. Hearing your own voice catches typos and wrong assumptions that silent reading misses. I have fixed bugs this way with zero tooling.
Using the console
When reading is not enough, log values.
Suppose result is wrong:
const a = calculateA()
const b = calculateB()
const result = a + b
Add logs before the calculation:
const a = calculateA()
const b = calculateB()
console.log(a)
console.log(b)
const result = a + b
alert() works for simple strings and numbers. For objects and arrays, use the Console API in JavaScript instead:
console.log({ a, b, result })The output lands in the browser console. I use Chrome DevTools in these examples, but the ideas transfer to Firefox and Safari with small UI differences.
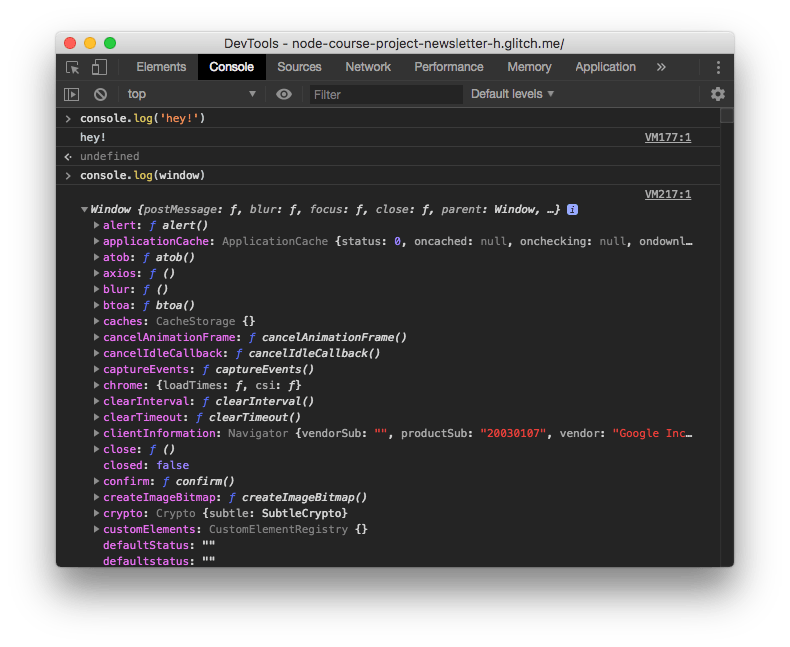
The console prints nested objects and arrays. You can expand each property in the tree.
The debugger
The debugger is the most powerful panel in DevTools. Open the Sources tab to find it:
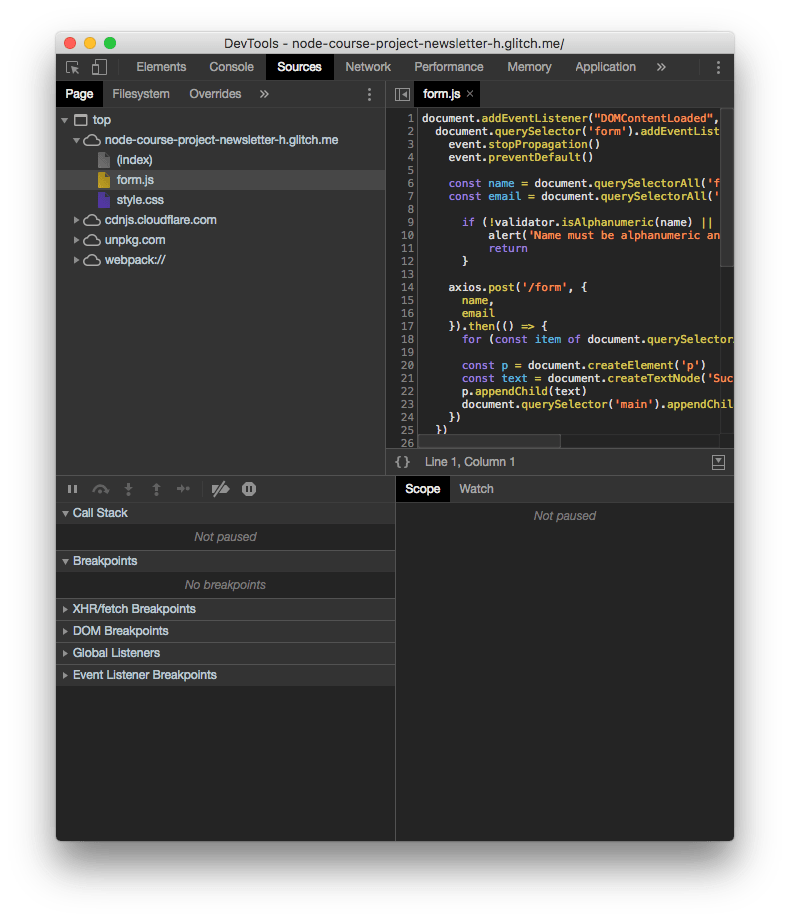
The file tree sits on the left. Pick a file and its source appears on the right. Breakpoints attach to specific lines there.
The bottom pane is where execution pauses and where you inspect state.
Breakpoints
JavaScript runs until it hits a breakpoint, then it stops.
A breakpoint can be a debugger statement in your code:
function submitForm(data) {
  debugger
  save(data)
}
When DevTools is open, the browser halts on that line.
You can also click a line number in the Sources panel:
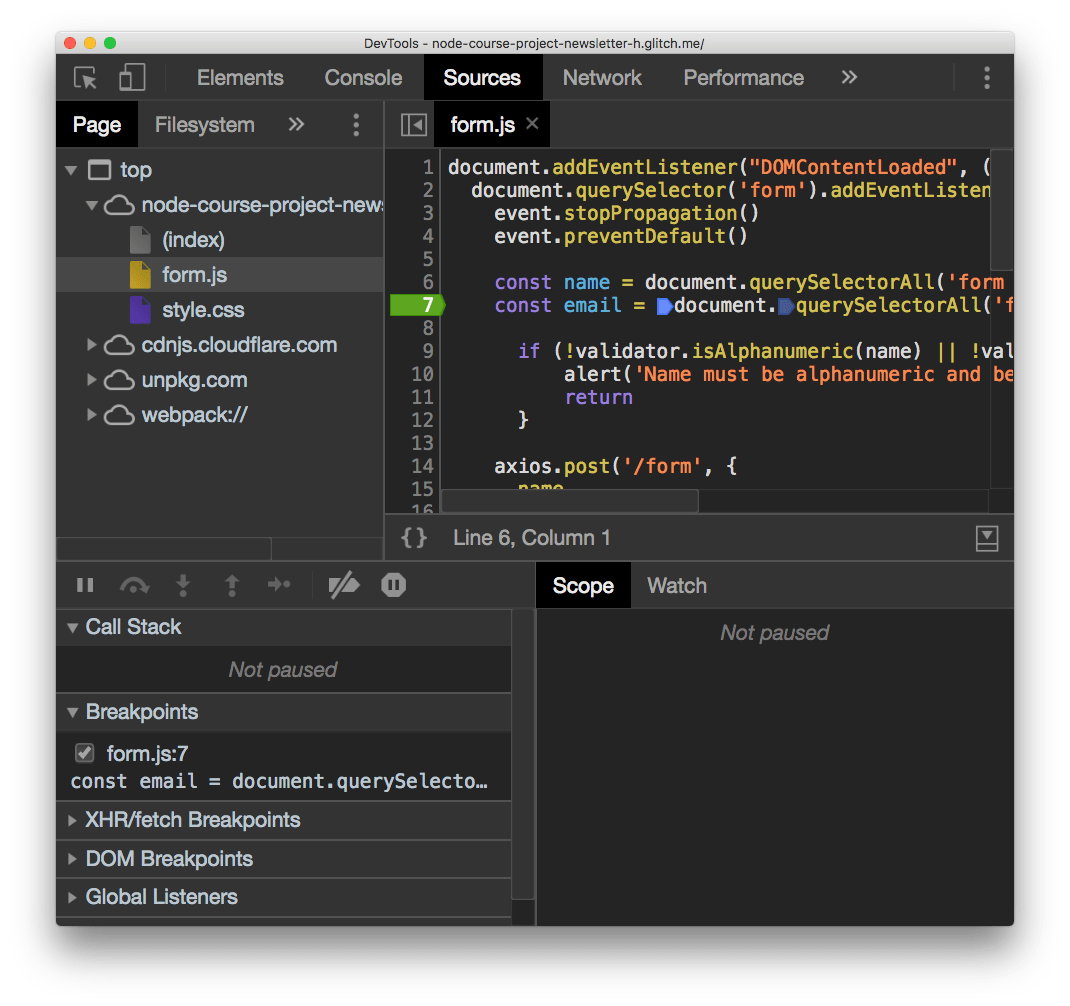
Click again to remove it. Reload the page and execution stops when that line runs.
The Breakpoints sidebar lists every breakpoint you set. You can disable one temporarily without deleting it.
DevTools also offers specialized breakpoints:
- XHR/fetch breakpoints: pause when a network request starts
- DOM breakpoints: pause when an element changes
- Event listener breakpoints: pause on events like clicks
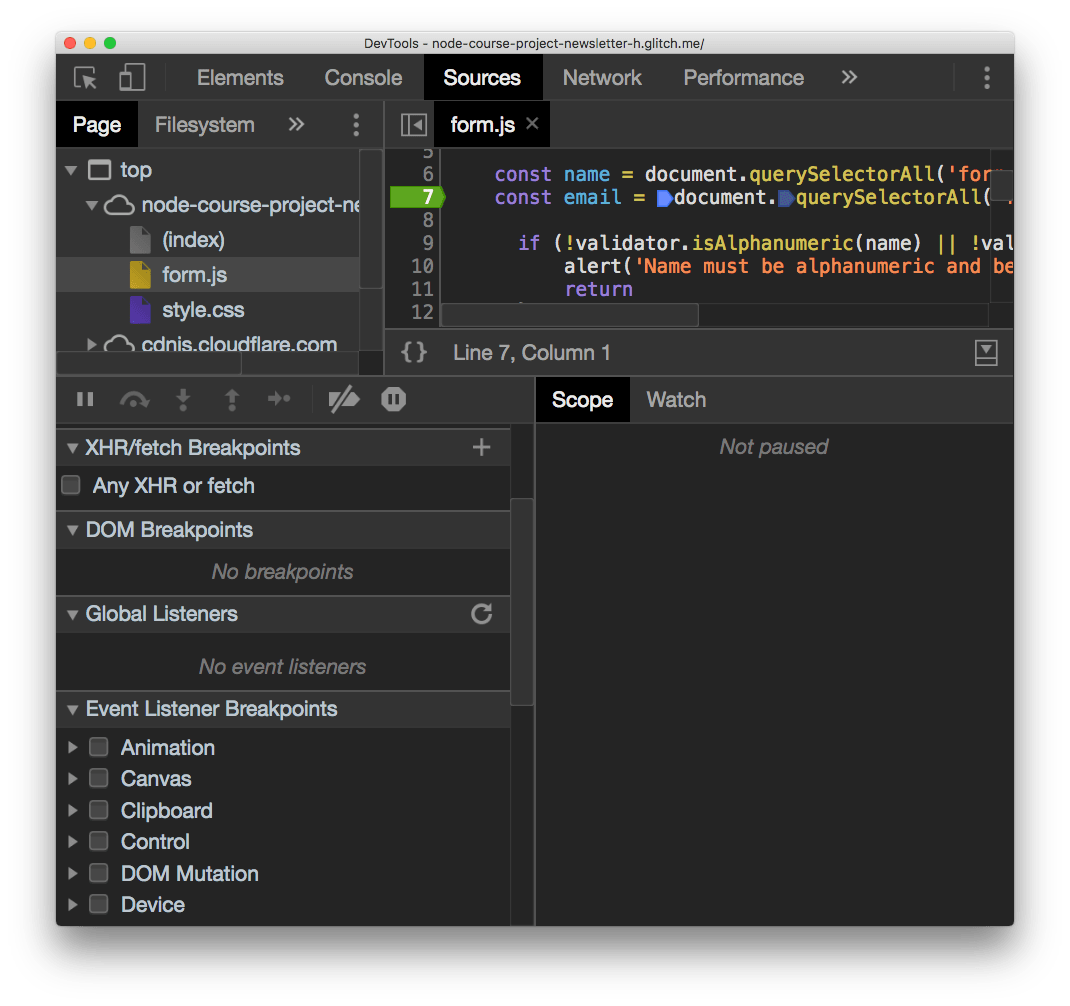
Scope
Breakpoints inside event handlers only fire when the event runs. Here I paused inside a form submit listener, so I had to submit the form to trigger it:
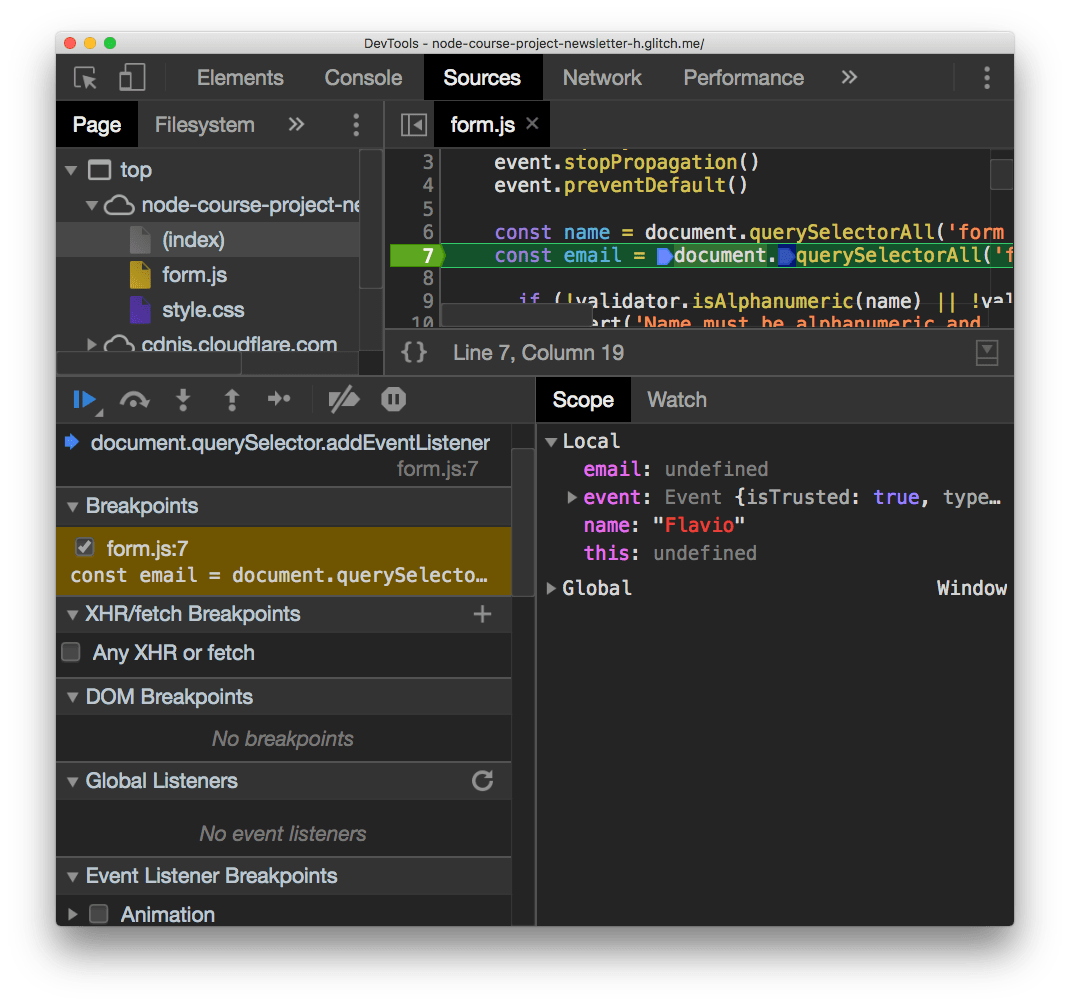
While paused, the Scope panel lists variables visible at that line: locals, closures, and globals. Double-click a value to edit it and test a fix on the spot.
Watch variables and expressions
Next to Scope sits Watch. Click + and type any expression.
Add name to see the current value, maybe Flavio. Add name.toUpperCase() and Watch evaluates it live, printing FLAVIO:
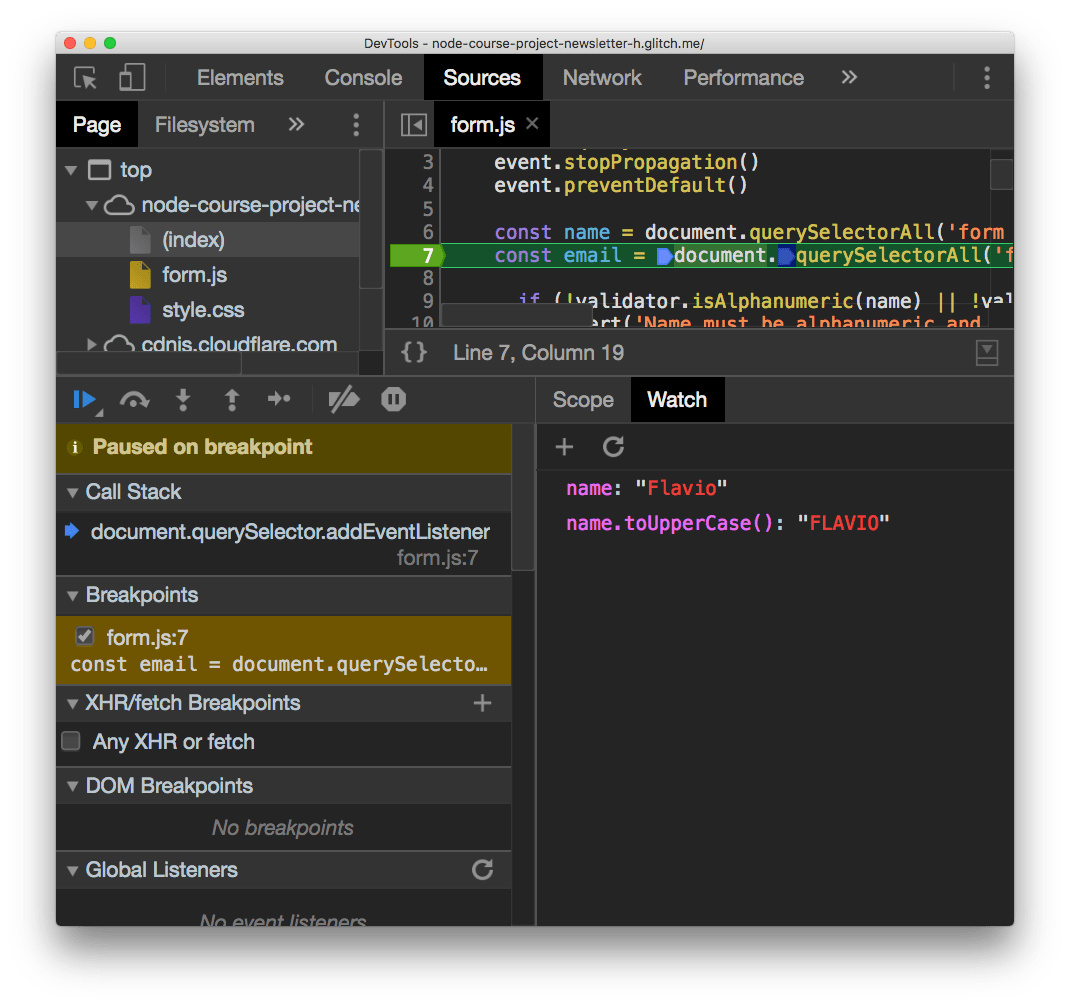
Watch is how I track values that are not stored in one variable.
Resume the execution
When execution is paused, a toolbar appears above the “Paused on breakpoint” banner.
The blue button resumes normal execution until the next breakpoint.
Step over runs the current line and stops on the next one in the same function.
Step into enters the function call on the current line so you can debug inside it.
Step out finishes the current function and pauses in the caller.
Those four controls are how you walk through code line by line without drowning in noise.
Edit scripts
You can edit source directly in the Sources panel, even while paused. Change the file and press cmd-S on Mac or ctrl-S on Windows/Linux.
The running session picks up your edit for that pause. Changes do not hit disk unless you set up DevTools workspaces, which is a separate advanced topic.
Inspect the call stack
The call stack shows how deep you are: which function called which, all the way to the entry point. Click a frame to jump to that function’s source and inspect its locals:
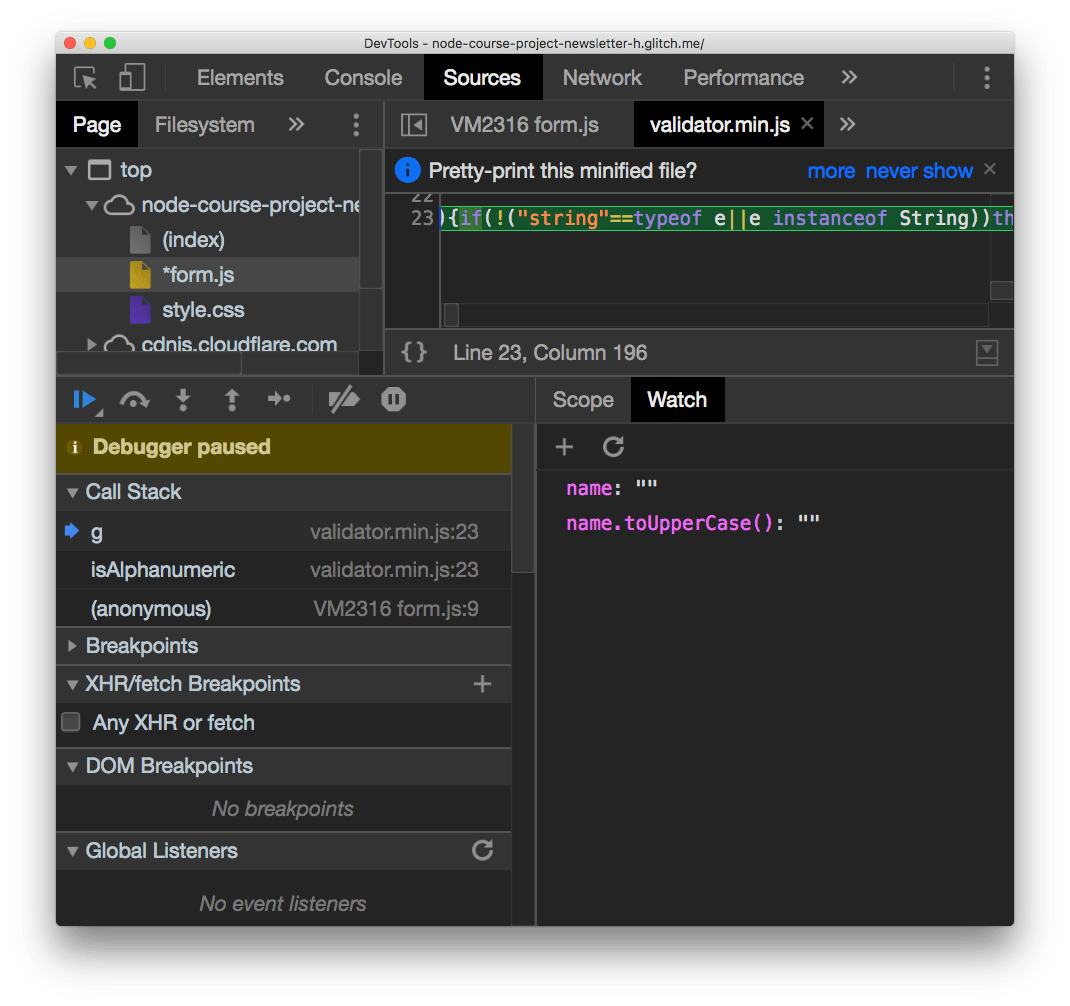
When an error feels far from the symptom, the call stack is where I look first.
Blackbox scripts
Third-party libraries belong in the call stack, but I rarely want to step through them. Email validation from validator.min.js is a good example: I trust it works.
Right-click the script in the call stack and choose Blackbox script. DevTools skips that file on step into, so you stay in your own code.
Use the browser devtools to debug Node.js
Node.js runs on the same v8 engine as Chrome, so you can attach the same DevTools to a server process.
Open your terminal and run:
node --inspect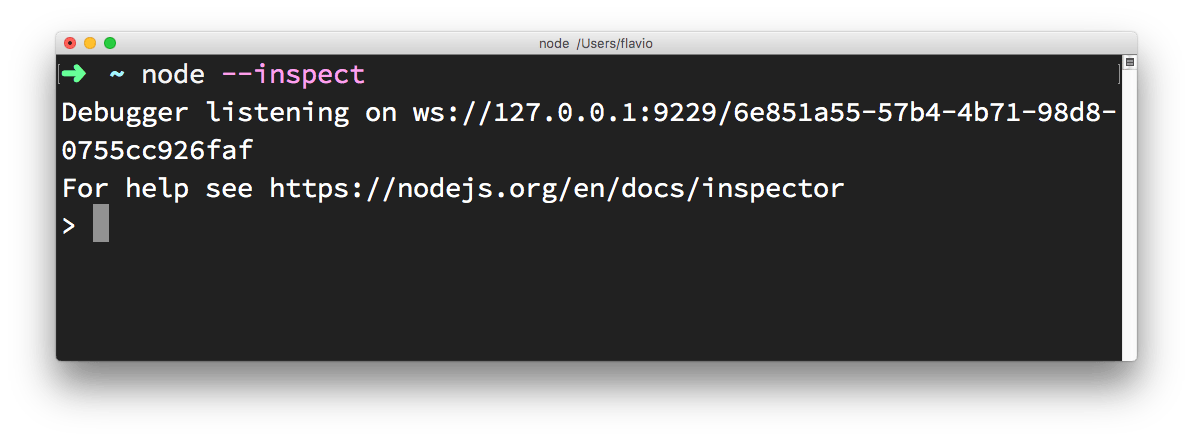
In Chrome, open about://inspect.
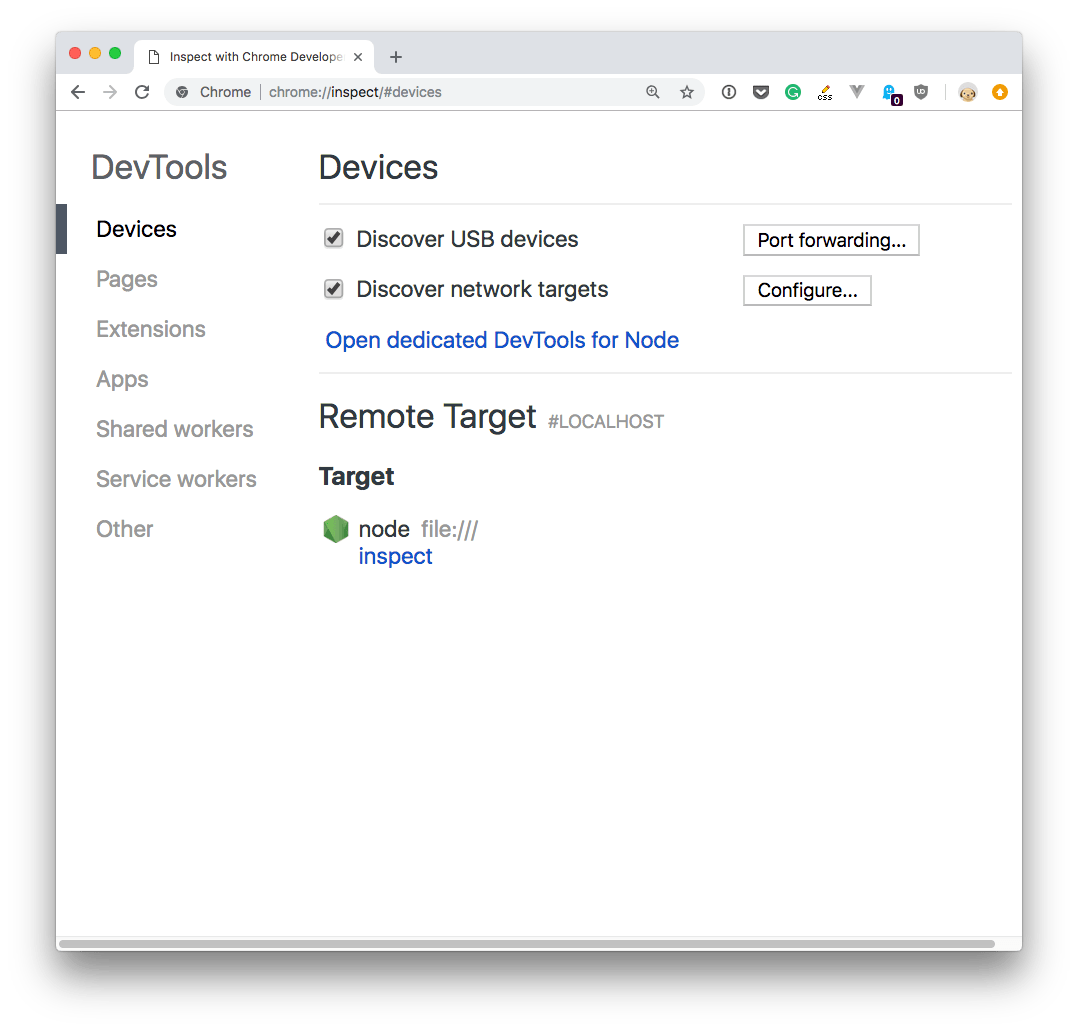
Click Open dedicated DevTools for Node next to your target. That window reconnects when you restart Node.
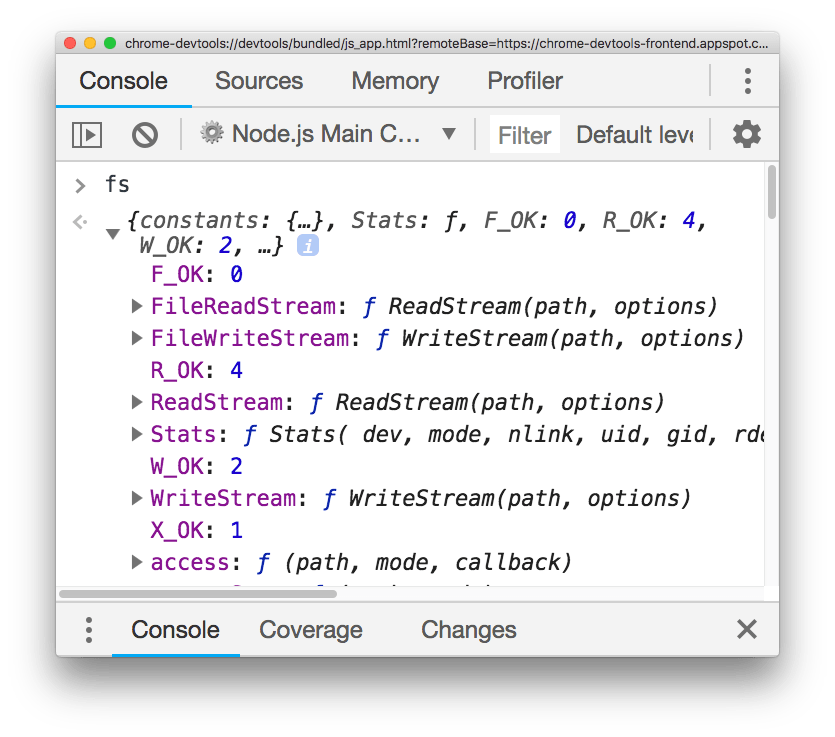
Try this on your own project: log two values to narrow a bug, then replace the logs with one breakpoint once you know the line.
Lesson completed