Get a 30-day Plausible traffic report in your terminal
By Flavio
Updated
Print a 30-day traffic report from self-hosted Plausible in Terminal with Plausible Automation Toolkit, compare it with the previous period and export it.
You self-host Plausible, and once a week you want the same numbers: how many people came in the last 30 days, which pages they read, where they came from, and whether that’s more or less than the month before.
The dashboard has all of that, but it’s a browser tab, a login, a date picker and a comparison toggle. When you want the numbers in a note, a spreadsheet or a coding agent’s context, you end up copying them by hand.
Plausible Automation Toolkit prints that report in Terminal. One command queries your own Plausible Community Edition instance through its Stats API and gives you the summary, top pages, top sources and goals, with an optional comparison against the previous period.
By the end you’ll have a 30-day report with the comparison, the same report as Markdown and CSV files, a breakdown by country or page, and a read-only setup you can hand to an agent.
What you need
The toolkit runs on macOS with Python 3.10 or newer. It also needs the system security and expect commands, because it keeps your dashboard login and API keys in the macOS login Keychain.
You need a self-hosted Plausible Community Edition instance, reachable over HTTPS, and an account on it. The CLI refuses plain HTTP. If you don’t have an instance yet, How to self-host Plausible analytics covers the server side.
The toolkit is a source download. After purchasing it, download the source zip from your Polar receipt, unzip it, open Terminal in that folder and run the installer with your instance’s address:
./install.sh --plausible-url https://plausible.hostingpicker.devThe installer puts two commands in ~/.local/bin: plausible-setup, which this tutorial uses most, and plausible, a read-only analytics command we’ll use at the end. If your shell can’t find them, add ~/.local/bin to your PATH and open a new Terminal window.
In this tutorial, plausible.hostingpicker.dev is the Plausible server and hostingpicker.dev the tracked site. Those names, the paths and the traffic numbers in the output are examples; the output format is what the CLI prints.
As a preflight check, confirm the command runs:
plausible-setup --versionplausible-setup 1.1.2Save your instance and login once
A report needs two things before it can query anything: the address of your Plausible server, and a way to authenticate. The first time, the toolkit logs in to your dashboard to create a Stats API key for itself, so it needs your dashboard login too.
Without these, every report stops before it sends a request. Saving them once means each later report is a single command. The address isn’t a secret, so it goes in a config file. The password is, so it goes in Keychain, never in a file or your shell history.
If you passed --plausible-url to the installer, the address is already saved. To change it later, run configure:
plausible-setup configure --plausible-url https://plausible.hostingpicker.devSaved Plausible instance https://plausible.hostingpicker.dev in /Users/flavio/.config/plausible-setup/config.json.Then store your dashboard login:
plausible-setup credentialsPlausible email: flavio@hostingpicker.dev
Paste the Plausible password at the secure Keychain prompt.
Saved Plausible credentials in Keychain service plausible:plausible.hostingpicker.dev.The password goes into a hidden prompt from the macOS security command, so it doesn’t appear on screen. If your account uses two-factor authentication, the CLI can’t log in and won’t try to bypass it. In that case, use the plausible command from the last section, which only needs a Stats API key you create yourself.
Run the 30-day report
The report command sends a handful of queries to Plausible’s Stats API v2: one for the summary, one each for top pages, top sources and goals. It prints them as one text report.
The default period is 7d, so for a 30-day report you pass --period 30d. Forget it and you get a week of data that looks fine but answers a different question.
Example 1: the first 30-day report for hostingpicker.dev
plausible-setup report --domain hostingpicker.dev --period 30dCreated and stored a Stats API key in plausible-stats:plausible.hostingpicker.dev.
Plausible report for hostingpicker.dev (30d)
Visitors: 3,412 Visits: 4,105 Pageviews: 6,920
Bounce rate: 61% Average visit: 1m 14s
Top pages
/: visitors 1,180, pageviews 1,544
/best-vps-for-wordpress/: visitors 702, pageviews 811
/cloudflare-pages-vs-netlify/: visitors 455, pageviews 530
/compare/: visitors 301, pageviews 612
/hetzner-review/: visitors 244, pageviews 268
Top sources
Google: visitors 2,104
Direct / None: visitors 688
DuckDuckGo: visitors 231
Bing: visitors 176
news.ycombinator.com: visitors 94
Goals
Newsletter Signup: conversions 58, conversion rate 1.7%The first line only appears on the first run. Here’s the mechanism: the CLI logs in with your Keychain credentials, opens the dashboard’s API key form, keeps its hidden security fields, and submits it with the name Plausible CLI. It hands the new key to a small helper over standard input, so the key never shows up in a command line, and the helper saves it in Keychain. From the second run on, the report reads that key and skips the login.
That line goes to stderr, so it doesn’t end up in a file when you redirect the report.
Each section lists up to 10 rows. Change that with --limit, anywhere from 1 to 100. A section with nothing in it, like goals on a site without any, prints No data.
The new key shows up under your Plausible account’s API keys as Plausible CLI. To undo it, revoke it there and delete the plausible-stats: item in Keychain Access. To replace it with a fresh one, run plausible-setup stats-key --refresh.
If you run report from the site’s source folder, you can leave out --domain. The CLI reads the domain from Astro’s site setting, the homepage in package.json, or a folder name with a dot in it, like hostingpicker.dev.
Compare with the previous 30 days
A single 30-day number doesn’t tell you much. 3,412 visitors is good or bad depending on last month. --compare previous adds a second summary for the period right before, with the change in percent.
The previous range isn’t something Plausible works out for you. The CLI calculates it on your Mac from today’s date, then queries both ranges. For 30d, the current range starts 29 days ago, and the previous one is the 30 days before that.
plausible-setup report --domain hostingpicker.dev --period 30d --compare previousPlausible report for hostingpicker.dev (30d)
Visitors: 3,412 Visits: 4,105 Pageviews: 6,920
Bounce rate: 61% Average visit: 1m 14s
Compared with 2026-09-14 to 2026-10-13
Visitors: 3,412 vs 2,876 (+18.6%)
Visits: 4,105 vs 3,490 (+17.6%)
Pageviews: 6,920 vs 5,811 (+19.1%)
Top pages
/: visitors 1,180, pageviews 1,544
...I ran this on 12 November, so the current range starts on 14 October. The comparison covers visitors, visits and pageviews. Top pages, sources and goals are only for the current period. When the previous period has zero of something and the current one doesn’t, the change reads new instead of a percentage.
This is the same report on the toolkit’s tidepoolsurf.com demo, with --limit 4. It was that site’s first report, so the “Created and stored” line is there too:
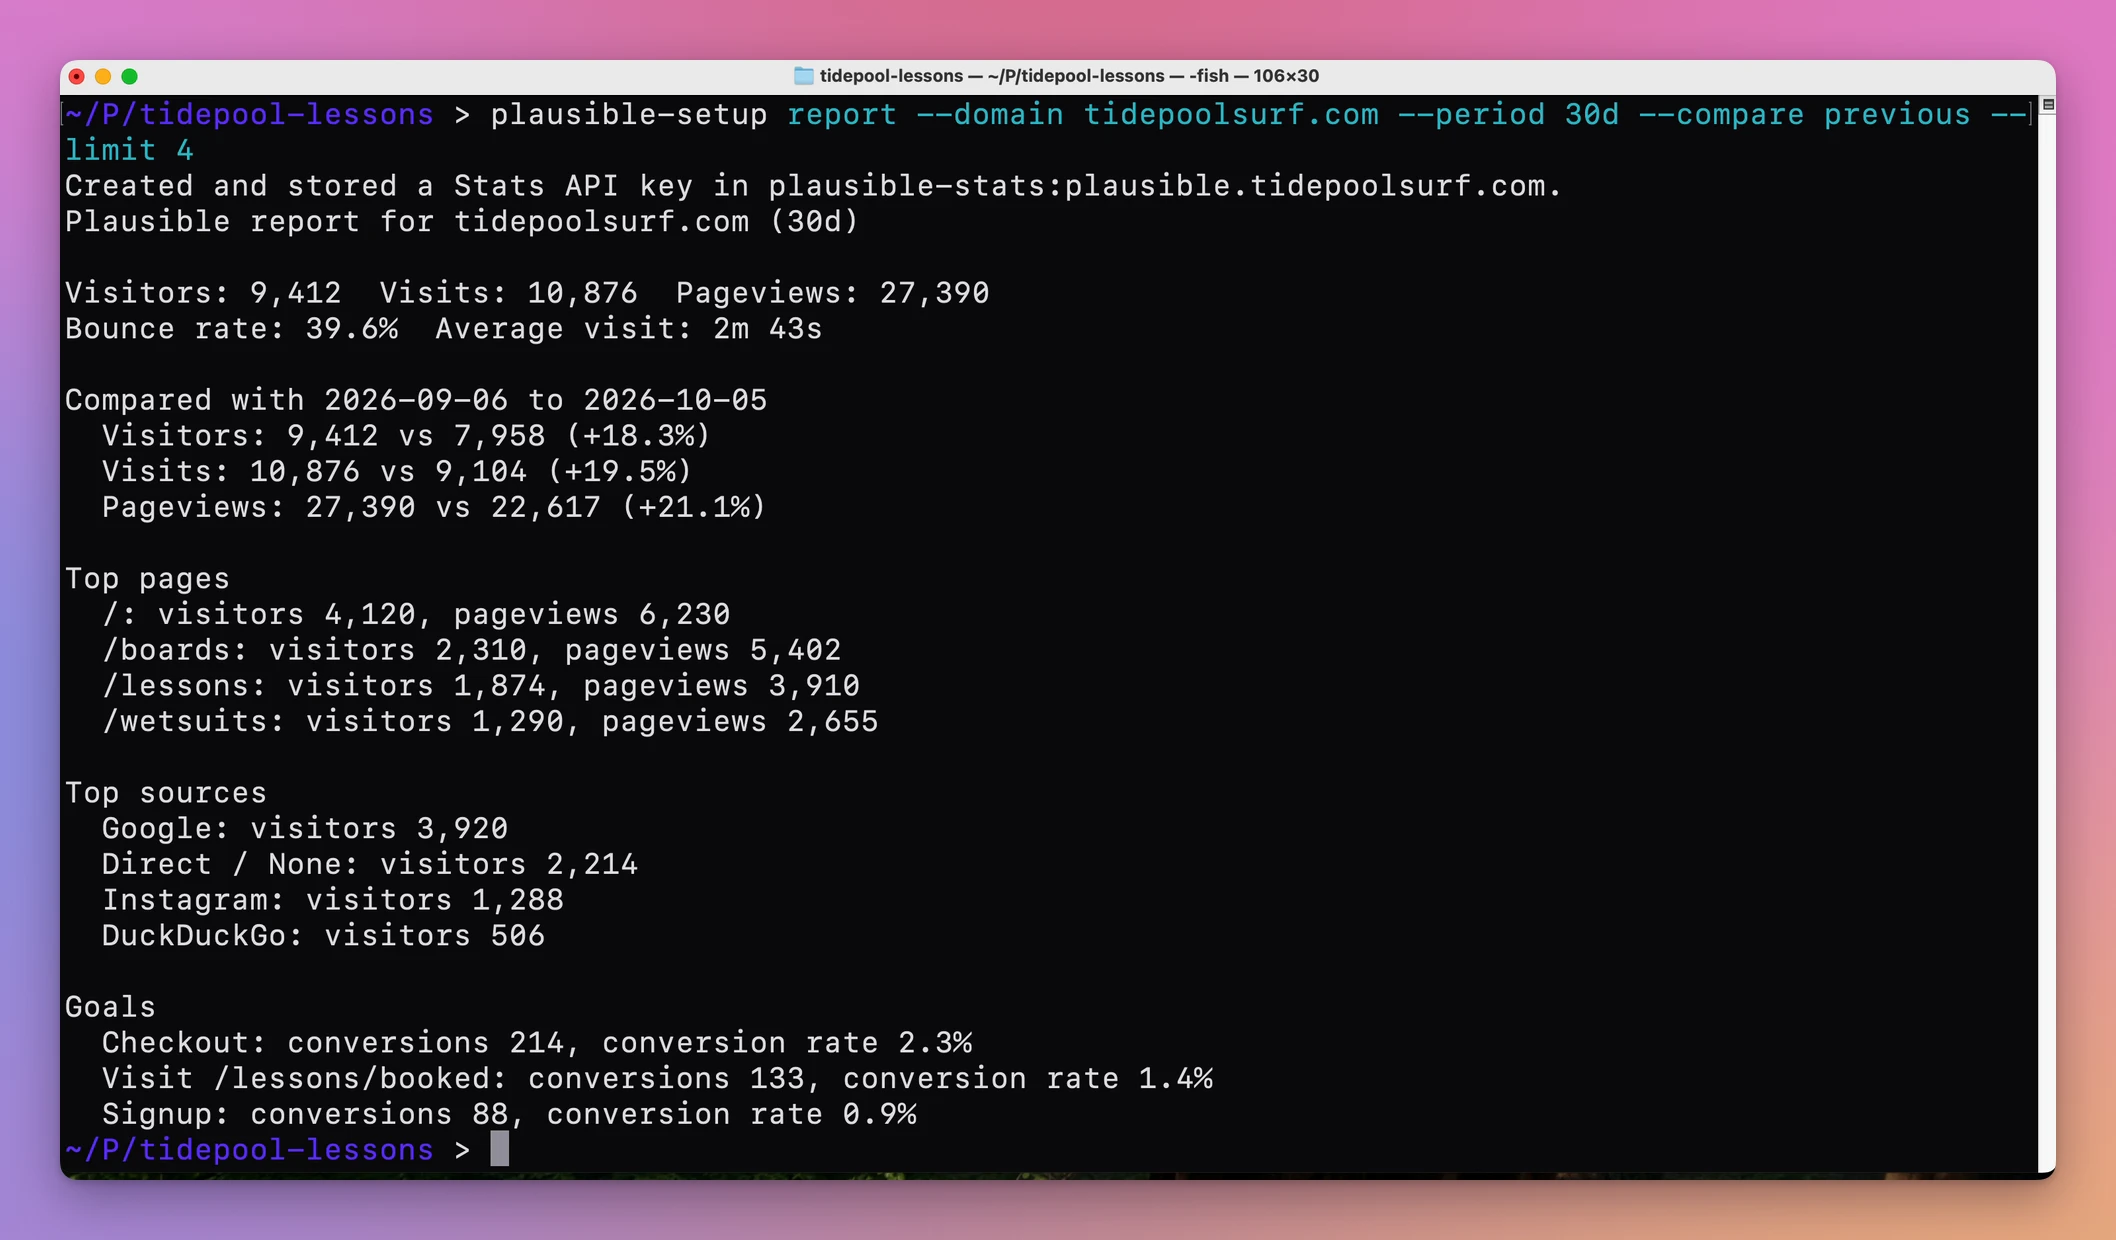
If you’d rather click, the dashboard does the same comparison: open the date picker and choose Compare.
Example 2: month to date instead of 30 days
A rolling 30 days is great for trends, but sometimes you want the calendar month. Pass --period month:
plausible-setup report --domain hostingpicker.dev --period month --compare previous --limit 3Plausible report for hostingpicker.dev (month)
Visitors: 1,388 Visits: 1,652 Pageviews: 2,790
Bounce rate: 60% Average visit: 1m 17s
Compared with 2026-10-20 to 2026-10-31
Visitors: 1,388 vs 1,410 (-1.6%)
Visits: 1,652 vs 1,701 (-2.9%)
Pageviews: 2,790 vs 2,884 (-3.3%)Notice the comparison range. It isn’t all of October. The CLI counts the days from the 1st to today, 12 here, and compares them with the 12 days just before the 1st. That keeps the comparison fair: you never compare 12 days with 31.
Example 3: a period the comparison can’t handle
The comparison understands day, any number of days like 7d or 30d, month and year. Other period names stop it:
plausible-setup report --domain hostingpicker.dev --period 6mo --compare previousError: --compare previous supports day, Nd, month, or year periods.The CLI checks this before it can work out a previous range, so nothing is compared. The fix is to switch to a period it supports, like 30d, month or year, and keep --compare previous.
Save the report as Markdown or CSV
Text in Terminal is fine for a glance. For anything you keep, like a monthly note, a client update or a spreadsheet with a row per month, you want a file in a format other tools read.
--format takes text, markdown, csv or json. Without it, copying from Terminal loses the table structure, and you end up retyping numbers. Redirect the output to a file and the file has the whole report, because the “Created and stored” line from the first run goes to stderr.
plausible-setup report --domain hostingpicker.dev --period 30d --compare previous --limit 3 --format markdown > hostingpicker-2026-11.md# Plausible report: hostingpicker.dev
Period: `30d`
| Metric | Value |
| --- | ---: |
| Visitors | 3,412 |
| Visits | 4,105 |
| Pageviews | 6,920 |
| Bounce rate | 61% |
| Average visit | 1m 14s |
## Previous period
Compared with `2026-09-14 to 2026-10-13`.
| Metric | Current | Previous | Change |
| --- | ---: | ---: | ---: |
| Visitors | 3,412 | 2,876 | +18.6% |
| Visits | 4,105 | 3,490 | +17.6% |
| Pageviews | 6,920 | 5,811 | +19.1% |
## Top pages
| Name | Visitors | Pageviews |
| --- | ---: | ---: |
| / | 1,180 | 1,544 |
| /best-vps-for-wordpress/ | 702 | 811 |
| /cloudflare-pages-vs-netlify/ | 455 | 530 |The file goes on with the sources and goals tables. CSV uses a long format, one value per row, which is easy to filter in a spreadsheet:
plausible-setup report --domain hostingpicker.dev --period 30d --limit 2 --format csvsection,name,metric,value
summary,,visitors,3412
summary,,visits,4105
summary,,pageviews,6920
summary,,bounce_rate,61
summary,,visit_duration,74
top_pages,/,visitors,1180
top_pages,/,pageviews,1544
top_pages,/best-vps-for-wordpress/,visitors,702
top_pages,/best-vps-for-wordpress/,pageviews,811
top_sources,Google,visitors,2104
top_sources,Direct / None,visitors,688
goals,Newsletter Signup,conversions,58
goals,Newsletter Signup,conversion_rate,1.7The CSV keeps raw numbers: no thousands separators, and visit duration in seconds. With --compare previous, it adds previous rows for the summary metrics. JSON is the most complete: it keeps each Stats API response as Plausible returned it, under summary, pages, sources and goals, which is what you want for a script.
The > overwrites the file each time. Put the month in the filename, like above, and last month’s file stays safe.
Drill into one dimension with a breakdown
The report answers “how did the site do”. The next question is usually narrower: where are the visitors from, or which pages does Google send people to.
A breakdown groups the traffic by one dimension, like country, source, page, device, browser, goal or a custom property as prop:NAME. It’s a separate query, so it doesn’t make the main report longer. Without it, you’d only see the top 10 sources and pages, never how they combine.
plausible-setup breakdown --domain hostingpicker.dev --period 30d --by countryPlausible breakdown for hostingpicker.dev (30d) by country
United States: visitors 1,302, percentage 38.2
Germany: visitors 411, percentage 12
United Kingdom: visitors 289, percentage 8.5
India: visitors 240, percentage 7
Italy: visitors 133, percentage 3.9On the demo site, the visitors by country look like this:
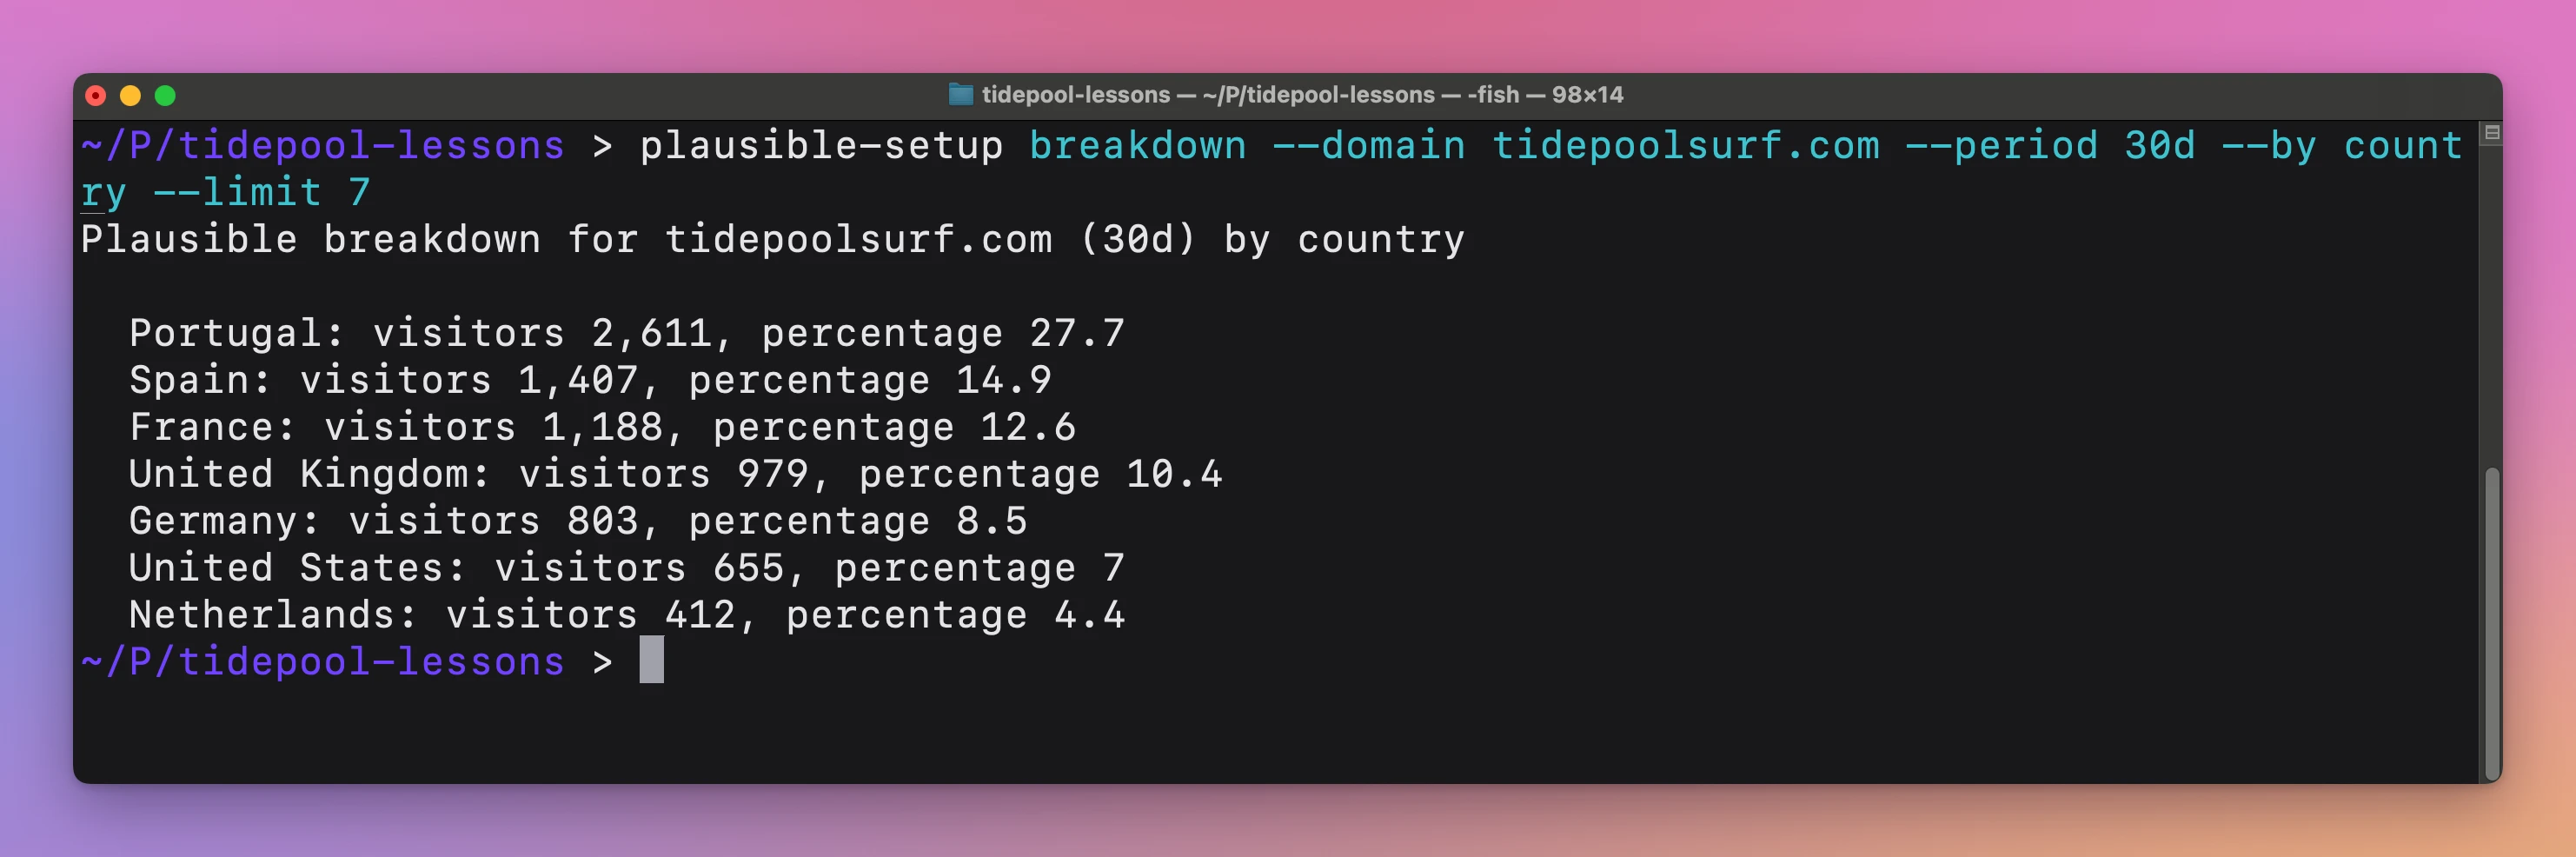
In the dashboard, it’s the Countries tab of the Locations panel.
Add --filter to narrow it down. This lists the pages visitors from Google landed on:
plausible-setup breakdown --domain hostingpicker.dev --period 30d --by page --filter source=Google --limit 3Plausible breakdown for hostingpicker.dev (30d) by page
/best-vps-for-wordpress/: visitors 588, pageviews 640
/cloudflare-pages-vs-netlify/: visitors 391, pageviews 433
/hetzner-review/: visitors 212, pageviews 229You can repeat --filter. A * in the value turns an exact match into a “contains” match, so --filter page=/blog* matches every page whose path contains /blog. Breakdowns take the same --format options as the report.
Make it a monthly habit
The report is most useful when you run it the same way every time. Same period, same comparison, same file name pattern. Then this month’s file sits next to last month’s, and the differences jump out. Mix a 30d report with a month one, and you end up comparing ranges that don’t line up.
I’d keep it to one line you can rerun. A small shell function in ~/.zshrc does it, and puts the date in the file name for you:
traffic() {
  plausible-setup report --domain "$1" --period 30d --compare previous --format markdown > "$1-$(date +%Y-%m-%d).md"
}
Then traffic hostingpicker.dev writes hostingpicker.dev-2026-11-12.md in the current folder. The function holds no secret: the key stays in Keychain, and the CLI reads it on each run. The toolkit’s README makes the same point about schedulers. They should run read-only report commands and never put Keychain secrets in a script or job definition.
Run it a second time on the same day and it overwrites that day’s file with fresh numbers, which is what you want.
Give an agent a read-only key with the plausible command
plausible-setup can create properties and goals, and it holds your dashboard password. That’s more than you want to hand a coding agent that only needs to read numbers.
The second command, plausible, only reads. It uses a Stats API key you create yourself, never your password, and it never creates keys or changes anything on the instance. Its output is JSON by default, which agents parse well. Set it up once, in your own terminal:
plausible login --url https://plausible.hostingpicker.devIt tells you to open your account settings in Plausible, then API Keys, and create a Stats API key. Paste it at the hidden prompt and it goes into the same plausible-stats: Keychain item that plausible-setup uses. The key is checked on your first report, not at login.
Then the report works the same way, with --site instead of --domain:
plausible report --site hostingpicker.dev --period 30d --compare previous --format textIt prints the same text report as above. Without --format text, you get JSON, with up to 20 rows per section by default. plausible timeseries --site hostingpicker.dev --period 30d --interval day gives you the daily numbers behind the 30-day total.
If you use Codex, the toolkit’s skill also responds to “Show me Plausible traffic for the last 30 days.” Either way, keep keys out of the chat. plausible logout removes the CLI’s config file but keeps the Keychain key. To cut off access completely, revoke the key in Plausible.
If something looks wrong
- If you get
Error: Plausible is not configured., runplausible-setup configure --plausible-urlwith your instance’s HTTPS address. - If you get
Error: The Plausible URL must be an HTTPS origin., use thehttps://address of the instance, with no path. - If you get
Error: The required Plausible Keychain item is missing.on the first report, there’s no stored login to create the Stats API key with. Runplausible-setup credentialsand try again. - If you get
Error: Could not infer the public domain; pass --domain., you ran the report outside the site’s folder. Add--domain hostingpicker.dev. - If you get
Error: Domain must be a naked hostname such as example.com., you passed a URL with a path. Pass only the hostname. - If you get
Error: Unknown breakdown 'countries'., the error lists every valid name. Use the singularcountry. - If you get
Error: --limit must be between 1 and 100., pick a value in that range. Theplausiblecommand allows up to 10,000. - If
plausible reportprints{"error": "Plausible returned HTTP 401. Check your Stats API key and site access."}, the key is wrong or revoked, or it can’t see that site. Create a new one and runplausible loginagain.
Get Plausible Automation Toolkit
Install trackers, report traffic and manage goals on your own Plausible Community Edition instance. Includes a macOS CLI, Codex skill and MIT source.
See Plausible Automation Toolkit → · Read the docs · $20. See the app page for tax details, with full source code.
Want me to talk about your product? You can sponsor this site.