The complete guide to the Chrome DevTools Protocol
By Flavio
Tagged: Node.js
Learn to drive Chrome with the DevTools Protocol from Node.js with zero dependencies: pages, clicks, screenshots, PDFs, network, and replacing Puppeteer.
Every time you use Puppeteer, Playwright with Chrome, or an AI agent that drives a browser, the same thing happens underneath. A program opens a WebSocket to Chrome and sends it JSON messages like {"id":1,"method":"Page.navigate","params":{"url":"https://flaviocopes.com"}}.
That’s the Chrome DevTools Protocol, or CDP. It’s the protocol the DevTools panel itself uses to inspect a page, and Chrome exposes it to anyone who asks.
You can use it directly. With Node.js 22 you don’t even need a WebSocket package, because WebSocket is now a global. In this guide we’ll write a CDP client in about 80 lines, then use it to navigate pages, click and type, take screenshots, print PDFs, watch and block network requests, read console messages, and launch Chrome ourselves.
Then we’ll compare it with Puppeteer: what Puppeteer sends over the wire, which of its methods map to which CDP commands, and when it’s still the better choice.
All the code in this guide runs on Node.js 22.23 against Chrome 156 on macOS, and every output block is a real run.
What the Chrome DevTools Protocol is
Chrome can act as a server. When you start it with a debugging port, it listens for WebSocket connections and accepts commands grouped in domains: Page for navigation, Runtime for running JavaScript, Network for requests, Input for mouse and keyboard, and so on.
The protocol has three kinds of messages:
- commands you send, with an
id, amethodandparams - responses Chrome sends back, with the same
idand aresultor anerror - events Chrome sends on its own, with a
methodandparamsbut noid
The Chrome I used exposes 59 domains, with 674 commands and 232 events. You’ll use maybe 30 commands for most automation work.
| Domain | What it does | Commands | Events |
|---|---|---|---|
Page | Navigation, screenshots, PDFs, lifecycle | 65 | 28 |
Runtime | Run JavaScript, console messages, exceptions | 23 | 8 |
DOM | Query nodes, read their position | 57 | 19 |
Input | Mouse, keyboard, touch | 13 | 1 |
Network | Watch requests, cookies, cache, headers | 35 | 43 |
Fetch | Pause, block, modify or mock requests | 9 | 2 |
Emulation | Viewport, device, media features, CPU speed | 49 | 2 |
Target | Open, attach to and close tabs | 19 | 7 |
Browser | Version, close, downloads, permissions | 22 | 2 |
Performance | Runtime metrics | 4 | 1 |
All of these are marked stable. Many other domains, like Storage, CSS or Accessibility, are marked experimental, which means their commands can change between Chrome versions.
Start Chrome with remote debugging
On macOS, the Chrome binary lives inside the app bundle. We start it headless, with a debugging port and a separate profile folder:
"/Applications/Google Chrome.app/Contents/MacOS/Google Chrome" \
  --headless \
  --remote-debugging-port=9333 \
  --user-data-dir=/tmp/cdp-profile \
  --no-first-run \
  --no-default-browser-check
Chrome prints the WebSocket address it’s listening on:
DevTools listening on ws://127.0.0.1:9333/devtools/browser/b743a921-069a-408e-afc9-85903bcc4340On Linux the binary is usually google-chrome or chromium, and on Windows it’s chrome.exe in Program Files\Google\Chrome\Application, with the same flags.
The --user-data-dir flag is required. Since Chrome 136, the debugging port is ignored if you use your default profile, because any program that connects could read your cookies and saved sessions.
Drop --headless if you want to watch what happens. You get a normal Chrome window that your script controls.
I used port 9333 instead of the usual 9222. The first time I ran this command, another Chrome on my Mac was already listening on 127.0.0.1:9222. The new one printed bind() failed: Address already in use, then listened only on the IPv6 address [::1]:9222. So a request to http://127.0.0.1:9222 would have reached the other browser.
Pick an unusual port, or use --remote-debugging-port=0 to let Chrome choose a free one. We’ll do that later when we launch Chrome from Node.js.
The HTTP endpoints
Besides the WebSocket, the debugging port answers a few plain HTTP requests:
| Endpoint | What it returns |
|---|---|
/json/version | Browser version and the browser WebSocket URL |
/json/list | All targets: tabs, iframes, workers, extensions |
/json/new?url | Opens a new tab (needs a PUT request) |
/json/close/<id> | Closes a target |
/json/protocol | The full protocol definition as JSON |
Let’s ask for the version:
curl http://127.0.0.1:9333/json/version{
"Browser": "Chrome/156.0.8078.81",
"Protocol-Version": "1.3",
"User-Agent": "Mozilla/5.0 (Macintosh; Intel Mac OS X 10_15_7) AppleWebKit/537.36 (KHTML, like Gecko) HeadlessChrome/156.0.0.0 Safari/537.36",
"V8-Version": "15.6.75.27",
"webSocketDebuggerUrl": "ws://127.0.0.1:9333/devtools/browser/b743a921-069a-408e-afc9-85903bcc4340"
}Notice HeadlessChrome in the user agent. Sites can see it, and we’ll change it later.
/json/list was more surprising. Even with a brand new profile, it listed seven targets: the about:blank page I asked for, plus extension background pages, service workers and two chrome://omnibox-popup pages. Filter by "type": "page" when you look for tabs.
Send your first command
The webSocketDebuggerUrl is all we need. We connect to it, send Browser.getVersion, and print what comes back:
const res = await fetch('http://127.0.0.1:9333/json/version')
const { webSocketDebuggerUrl } = await res.json()

const ws = new WebSocket(webSocketDebuggerUrl)

ws.addEventListener('open', () => {
  ws.send(JSON.stringify({ id: 1, method: 'Browser.getVersion' }))
})

ws.addEventListener('message', (event) => {
  console.log(event.data)
  ws.close()
})
Save it as first.mjs and run node first.mjs:
{"id":1,"result":{"protocolVersion":"1.3","product":"Chrome/156.0.8078.81","revision":"@060bedfb508f73250e93aeb9ca8149b3958995d8","userAgent":"Mozilla/5.0 (Macintosh; Intel Mac OS X 10_15_7) AppleWebKit/537.36 (KHTML, like Gecko) HeadlessChrome/156.0.0.0 Safari/537.36","jsVersion":"15.6.75.27"}}That’s the whole protocol. The response has the id we sent, so we know which command it answers.
A command that fails returns an error instead of a result. I sent Page.navigate on this same connection, plus a typo:
{"id":1,"error":{"code":-32601,"message":"'Page.navigate' wasn't found"}}
{"id":2,"error":{"code":-32601,"message":"'Browser.getVersions' wasn't found"}}
The typo makes sense. But Page.navigate is a real command, so why wasn’t it found? Because we’re talking to the browser, and the browser has no page to navigate.
Targets and sessions
Chrome organizes everything as targets. The browser is a target, every tab is a target, and so are iframes from other sites, service workers and extension pages.
Each target supports different domains. The browser target knows Browser and Target. A page target knows Page, Runtime, DOM, Network and the rest.
To control a page, we create one with Target.createTarget, then attach to it with Target.attachToTarget. Attaching gives us a session ID. From then on, any message that includes that sessionId goes to the page instead of the browser.
The flatten: true option matters. Without it, page messages travel wrapped inside Target.sendMessageToTarget commands, as JSON strings inside JSON. With it, they go straight over the same WebSocket with a sessionId field. Puppeteer and Playwright use flat mode, and so will we.
You can also open a separate WebSocket to each page using the webSocketDebuggerUrl from /json/list. That works for quick scripts, but one connection with sessions is easier to manage once you have several pages.
A tiny CDP client in Node.js
Sending raw JSON gets old quickly. We need three things:
- a
send()that assigns anidand returns a promise that resolves with the response - an
on()to listen for events, filtered by session - a
newPage()helper that creates a target and attaches to it
Here’s the whole thing. Save it as cdp.mjs:
export async function connect(url = 'http://127.0.0.1:9333') {
  if (url.startsWith('http')) {
    const res = await fetch(`${url}/json/version`)
    const { webSocketDebuggerUrl } = await res.json()
    url = webSocketDebuggerUrl
  }

  const ws = new WebSocket(url)
  await new Promise((resolve, reject) => {
    ws.addEventListener('open', resolve, { once: true })
    ws.addEventListener('error', reject, { once: true })
  })

  let lastId = 0
  const pending = new Map()
  const listeners = new Map()

  ws.addEventListener('message', (event) => {
    const message = JSON.parse(event.data)

    if (message.id) {
      const { resolve, reject, method } = pending.get(message.id)
      pending.delete(message.id)
      if (message.error) {
        reject(new Error(`${method}: ${message.error.message}`))
      } else {
        resolve(message.result)
      }
      return
    }

    const key = `${message.sessionId ?? ''}:${message.method}`
    for (const listener of listeners.get(key) ?? []) {
      listener(message.params)
    }
  })

  function send(method, params = {}, sessionId) {
    const id = ++lastId
    ws.send(JSON.stringify({ id, method, params, sessionId }))
    return new Promise((resolve, reject) => {
      pending.set(id, { resolve, reject, method })
    })
  }

  function on(method, listener, sessionId) {
    const key = `${sessionId ?? ''}:${method}`
    if (!listeners.has(key)) listeners.set(key, new Set())
    listeners.get(key).add(listener)
    return () => listeners.get(key).delete(listener)
  }

  function once(method, sessionId) {
    return new Promise((resolve) => {
      const off = on(method, (params) => {
        off()
        resolve(params)
      }, sessionId)
    })
  }

  return { send, on, once, close: () => ws.close() }
}

export async function newPage(browser) {
  const { targetId } = await browser.send('Target.createTarget', { url: 'about:blank' })
  const { sessionId } = await browser.send('Target.attachToTarget', { targetId, flatten: true })

  return {
    targetId,
    sessionId,
    send: (method, params) => browser.send(method, params, sessionId),
    on: (method, listener) => browser.on(method, listener, sessionId),
    once: (method) => browser.once(method, sessionId),
    close: () => browser.send('Target.closeTarget', { targetId }),
  }
}
connect() accepts either the HTTP address of the debugging port or a WebSocket URL. It keeps a pending map from id to the promise waiting for it. When a message arrives with an id, it settles that promise. When a message has no id, it’s an event, and it goes to the listeners registered for that method and session.
JSON.stringify drops sessionId when it’s undefined, so the same send() works for browser commands and page commands.
newPage() returns an object with the session already bound. That’s what Puppeteer calls a Page, minus a few thousand lines.
Open a page and read its title
Now the client is useful. We open a page, navigate it, wait for the load event and read document.title:
import { connect, newPage } from './cdp.mjs'

const browser = await connect()
const page = await newPage(browser)

await page.send('Page.enable')
const loaded = page.once('Page.loadEventFired')
await page.send('Page.navigate', { url: 'https://flaviocopes.com' })
await loaded

const { result } = await page.send('Runtime.evaluate', {
  expression: 'document.title',
})
console.log(result)

await page.close()
browser.close()
{ type: 'string', value: 'Flavio Copes' }Domains are off until you enable them. Chrome sends Page events only after Page.enable, Network events only after Network.enable, and so on. If you wait for Page.loadEventFired without enabling Page, your script hangs forever.
Listen before you act. I create the loaded promise before calling Page.navigate. A fast page can fire load before Page.navigate even returns, and a listener added after that would miss it.
The whole script took 0.57 seconds, including the network round trip to my site.
Wait for the page to load
The load event isn’t always what you want. A page can fire load and then fetch half its content with JavaScript.
Page.setLifecycleEventsEnabled gives you every loading milestone as a Page.lifecycleEvent. Let’s print them with their timing:
import { connect, newPage } from './cdp.mjs'

const browser = await connect()
const page = await newPage(browser)

await page.send('Page.enable')
await page.send('Page.setLifecycleEventsEnabled', { enabled: true })

const start = Date.now()
const idle = new Promise((resolve) => {
  page.on('Page.lifecycleEvent', ({ name, frameId }) => {
    if (frameId !== page.targetId) return
    console.log(`${Date.now() - start}ms`, name)
    if (name === 'networkIdle') resolve()
  })
})

await page.send('Page.navigate', { url: 'https://flaviocopes.com' })
await idle

await page.close()
browser.close()
78ms init
101ms DOMContentLoaded
120ms firstMeaningfulPaintCandidate
120ms firstContentfulPaint
120ms firstPaint
120ms firstImagePaint
181ms load
782ms networkAlmostIdle
782ms firstMeaningfulPaint
783ms networkIdleThe frameId check filters out iframes. My homepage has a Cloudflare Turnstile iframe, and before I added the check, I got two init events. For a page target, the main frame ID is the same as the target ID.
networkIdle means no network connections for 500ms, and networkAlmostIdle means at most two. These are what Puppeteer’s waitUntil: 'networkidle0' and 'networkidle2' wait for.
Here load came at 181ms and networkIdle 600ms later. So waiting for network idle costs time on every navigation. Use it when the page loads data after load, and stick to load when it doesn’t.
Run JavaScript in the page
Runtime.evaluate runs an expression in the page and returns the result. By default, objects come back as a reference, not as data:
const a = await page.send('Runtime.evaluate', {
  expression: `[...document.querySelectorAll('main li a')].slice(0, 3).map((a) => a.textContent)`,
})
console.log(a.result)
{
type: 'object',
subtype: 'array',
className: 'Array',
description: 'Array(3)',
objectId: '614966600231285712.2.1'
}The objectId points to the array living inside the page. You can pass it to other commands like Runtime.callFunctionOn or DOM.requestNode. To get the actual values, add returnByValue: true:
const b = await page.send('Runtime.evaluate', {
  expression: `[...document.querySelectorAll('main li a')].slice(0, 3).map((a) => a.textContent)`,
  returnByValue: true,
})
console.log(b.result)
{
type: 'object',
value: [
'LiveKit tutorial: how to build a voice AI agent',
'I want my coding agent to do what I ask',
'Cloudflare Zero Wire: what it is and how to use it'
]
}The value is serialized as JSON, so DOM nodes, functions and other things that don’t serialize come back empty.
If the expression returns a promise, awaitPromise: true waits for it. Here the page fetches my RSS feed and returns its length:
const c = await page.send('Runtime.evaluate', {
  expression: `fetch('/rss.xml').then((res) => res.text()).then((text) => text.length)`,
  awaitPromise: true,
})
console.log(c.result)
{ type: 'number', value: 13234, description: '13234' }Be careful with errors. A JavaScript exception in the page doesn’t reject the command. The response is successful, and the error is inside exceptionDetails:
const d = await page.send('Runtime.evaluate', {
  expression: `document.querySelector('.missing').textContent`,
})
console.log(d.exceptionDetails.exception.description.split('\n')[0])
TypeError: Cannot read properties of null (reading 'textContent')Check exceptionDetails after every evaluation whose result you rely on, or you’ll read undefined and wonder why.
Wait for an element
Puppeteer has waitForSelector and locators that wait on their own. With CDP we write that part ourselves. The simplest version evaluates an expression every 100ms until it returns something truthy:
export async function waitFor(page, expression, timeout = 5000) {
  const start = Date.now()
  while (Date.now() - start < timeout) {
    const { result } = await page.send('Runtime.evaluate', {
      expression,
      returnByValue: true,
    })
    if (result.value) return result.value
    await new Promise((resolve) => setTimeout(resolve, 100))
  }
  throw new Error(`Timed out waiting for: ${expression}`)
}
Save it as wait.mjs. The hard part is choosing what to wait for, and that’s true with Puppeteer too.
I tested it on the search box of my homepage, which uses Pagefind. My first try waited for the results message to exist. It returned right away with Searching for puppeteer..., the loading text. My second try waited for any result link, and got 4, because Pagefind renders results in batches. What worked was waiting for 10 links, the number Pagefind shows on the first page.
Click and type
Puppeteer’s page.click() doesn’t call element.click(). It finds where the element is on screen and sends real mouse events there. We can do the same:
DOM.getDocumentandDOM.querySelectorfind the element’s nodeDOM.getBoxModelreturns its position as quads, four x/y points per boxInput.dispatchMouseEventpresses and releases the mouse at its center
Then Input.insertText types text into whatever has focus. Here’s the full search on my homepage:
import { writeFile } from 'node:fs/promises'
import { connect, newPage } from './cdp.mjs'
import { waitFor } from './wait.mjs'

const browser = await connect()
const page = await newPage(browser)

await page.send('Emulation.setDeviceMetricsOverride', {
  width: 1280,
  height: 800,
  deviceScaleFactor: 1,
  mobile: false,
})
await page.send('Page.enable')
const loaded = page.once('Page.loadEventFired')
await page.send('Page.navigate', { url: 'https://flaviocopes.com' })
await loaded

const { root } = await page.send('DOM.getDocument')
const { nodeId } = await page.send('DOM.querySelector', {
  nodeId: root.nodeId,
  selector: '.pagefind-ui__search-input',
})
const { model } = await page.send('DOM.getBoxModel', { nodeId })

const [x1, y1, , , x3, y3] = model.content
const x = (x1 + x3) / 2
const y = (y1 + y3) / 2

await page.send('Input.dispatchMouseEvent', { type: 'mousePressed', x, y, button: 'left', clickCount: 1 })
await page.send('Input.dispatchMouseEvent', { type: 'mouseReleased', x, y, button: 'left', clickCount: 1 })
await page.send('Input.insertText', { text: 'puppeteer' })

await waitFor(page, `document.querySelectorAll('.pagefind-ui__result-link').length >= 10`)

const { data } = await page.send('Page.captureScreenshot', { format: 'webp', quality: 80 })
await writeFile('out/search.webp', Buffer.from(data, 'base64'))

await page.close()
browser.close()
The box model for the search input was [53, 169, 1007, 169, 1007, 211, 53, 211]: top-left, top-right, bottom-right, bottom-left. So the click landed at 530, 190. Here’s the screenshot the script saved:
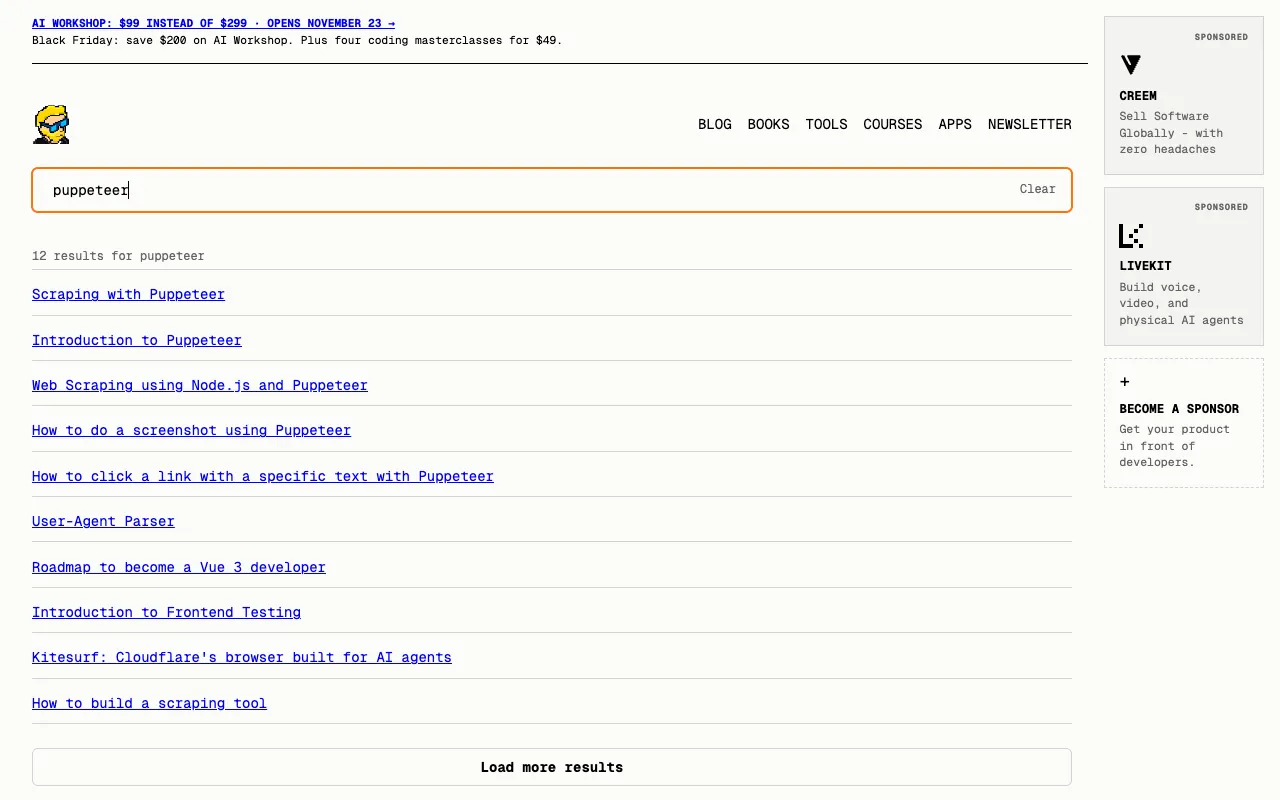
The coordinates are relative to the viewport. If the element is below the fold, scroll it into view first with DOM.scrollIntoViewIfNeeded, then read the box model again. Puppeteer does the same before every click.
Input.insertText inserts text in one go, like a paste. It’s marked experimental, but Puppeteer uses it too. For keys that do something, like Enter or Tab, use Input.dispatchKeyEvent with a keyDown and a keyUp:
const enter = { key: 'Enter', code: 'Enter', windowsVirtualKeyCode: 13, text: '\r' }
await page.send('Input.dispatchKeyEvent', { type: 'keyDown', ...enter })
await page.send('Input.dispatchKeyEvent', { type: 'keyUp', ...enter })
I tested it on a small form whose submit handler copies the input into document.title, and the title became chrome devtools protocol, the text typed with insertText. Without text: '\r', the key event fires but the form doesn’t submit.
This per-key detail is one thing Puppeteer saves you from. It ships a table with the key, code, keyCode and text for every key on a US keyboard.
Take screenshots
Page.captureScreenshot returns the image as base64. It supports png, jpeg and webp, so you can skip a conversion step. Set the viewport size first with Emulation.setDeviceMetricsOverride:
import { writeFile } from 'node:fs/promises'
import { connect, newPage } from './cdp.mjs'

const browser = await connect()
const page = await newPage(browser)

await page.send('Emulation.setDeviceMetricsOverride', {
  width: 1280,
  height: 800,
  deviceScaleFactor: 1,
  mobile: false,
})

await page.send('Page.enable')
const loaded = page.once('Page.loadEventFired')
await page.send('Page.navigate', { url: 'https://flaviocopes.com' })
await loaded

const { data } = await page.send('Page.captureScreenshot', { format: 'webp', quality: 80 })
await writeFile('out/homepage.webp', Buffer.from(data, 'base64'))

await page.close()
browser.close()
This produced a 1280×800 image of 89 KB:
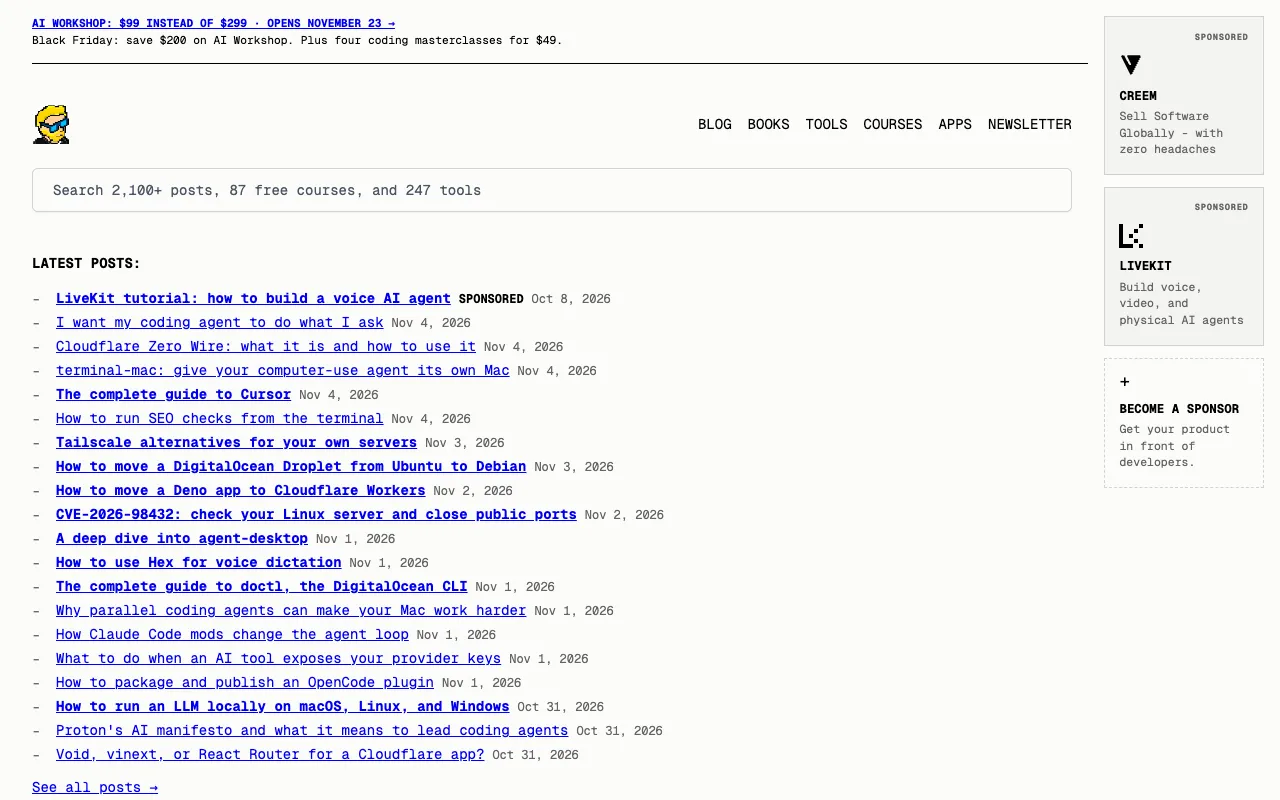
For a full page screenshot, ask Page.getLayoutMetrics for the content size, then capture a clip of that size with captureBeyondViewport:
const { cssContentSize } = await page.send('Page.getLayoutMetrics')
console.log(cssContentSize)

const { data } = await page.send('Page.captureScreenshot', {
  format: 'webp',
  captureBeyondViewport: true,
  clip: { x: 0, y: 0, width: cssContentSize.width, height: cssContentSize.height, scale: 1 },
})
{ x: 0, y: 0, width: 1280, height: 9846 }On my Puppeteer introduction that gave a 1280×9846 image of 451 KB.
To capture a single element, use its box model from DOM.getBoxModel as the clip.
Emulate a phone and dark mode
The Emulation domain changes how the page sees the device. Here we set an iPhone-sized viewport at 3x density, enable touch events, and tell the page the user prefers dark mode:
import { writeFile } from 'node:fs/promises'
import { connect, newPage } from './cdp.mjs'

const browser = await connect()
const page = await newPage(browser)

await page.send('Emulation.setDeviceMetricsOverride', {
  width: 390,
  height: 844,
  deviceScaleFactor: 3,
  mobile: true,
})
await page.send('Emulation.setTouchEmulationEnabled', { enabled: true })
await page.send('Emulation.setEmulatedMedia', {
  features: [{ name: 'prefers-color-scheme', value: 'dark' }],
})

await page.send('Page.enable')
const loaded = page.once('Page.loadEventFired')
await page.send('Page.navigate', { url: 'https://flaviocopes.com/puppeteer/' })
await loaded

const { data } = await page.send('Page.captureScreenshot', { format: 'webp', quality: 80 })
await writeFile('out/mobile-dark.webp', Buffer.from(data, 'base64'))

await page.close()
browser.close()
The screenshot came out at 1170×2532, three times 390×844. Here’s the top of it, resized:
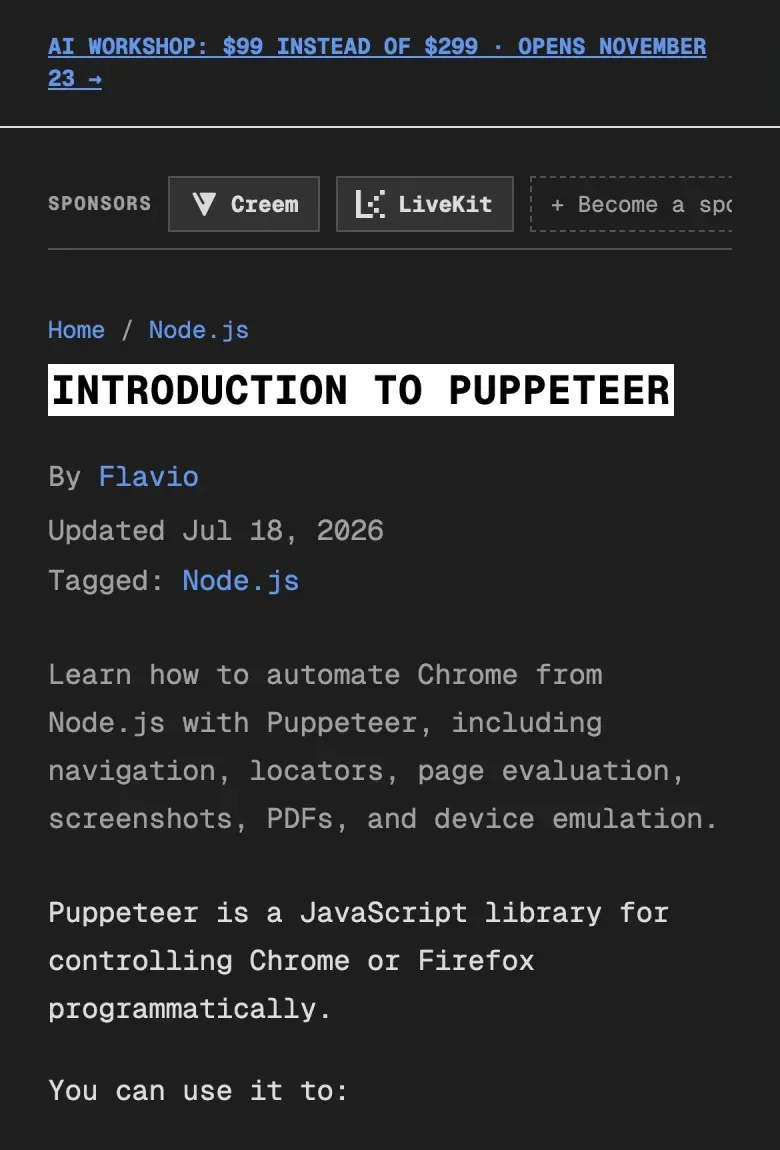
Other useful commands in this domain:
Emulation.setUserAgentOverridechanges the user agent, so you can dropHeadlessChromeEmulation.setGeolocationOverridesets the GPS positionEmulation.setTimezoneOverrideandEmulation.setLocaleOverridechange the timezone and languageEmulation.setEmulatedMediawithmedia: 'print'shows the print stylesheetEmulation.setCPUThrottlingRateslows the CPU down
Generate a PDF
Page.printToPDF prints the page like the browser’s print dialog does. Sizes are in inches, and the header and footer are HTML templates with special classes like pageNumber and totalPages:
import { writeFile } from 'node:fs/promises'
import { connect, newPage } from './cdp.mjs'

const browser = await connect()
const page = await newPage(browser)

await page.send('Page.enable')
const loaded = page.once('Page.loadEventFired')
await page.send('Page.navigate', { url: 'https://flaviocopes.com/puppeteer/' })
await loaded

const { data } = await page.send('Page.printToPDF', {
  paperWidth: 8.27,
  paperHeight: 11.69,
  printBackground: true,
  displayHeaderFooter: true,
  headerTemplate: '<span></span>',
  footerTemplate: '<div style="font-size:9px;width:100%;text-align:center"><span class="pageNumber"></span> / <span class="totalPages"></span></div>',
})
await writeFile('out/puppeteer.pdf', Buffer.from(data, 'base64'))

await page.close()
browser.close()
8.27×11.69 inches is A4. The result was a 10-page PDF of 409 KB. Here’s the first page, with the page counter at the bottom:
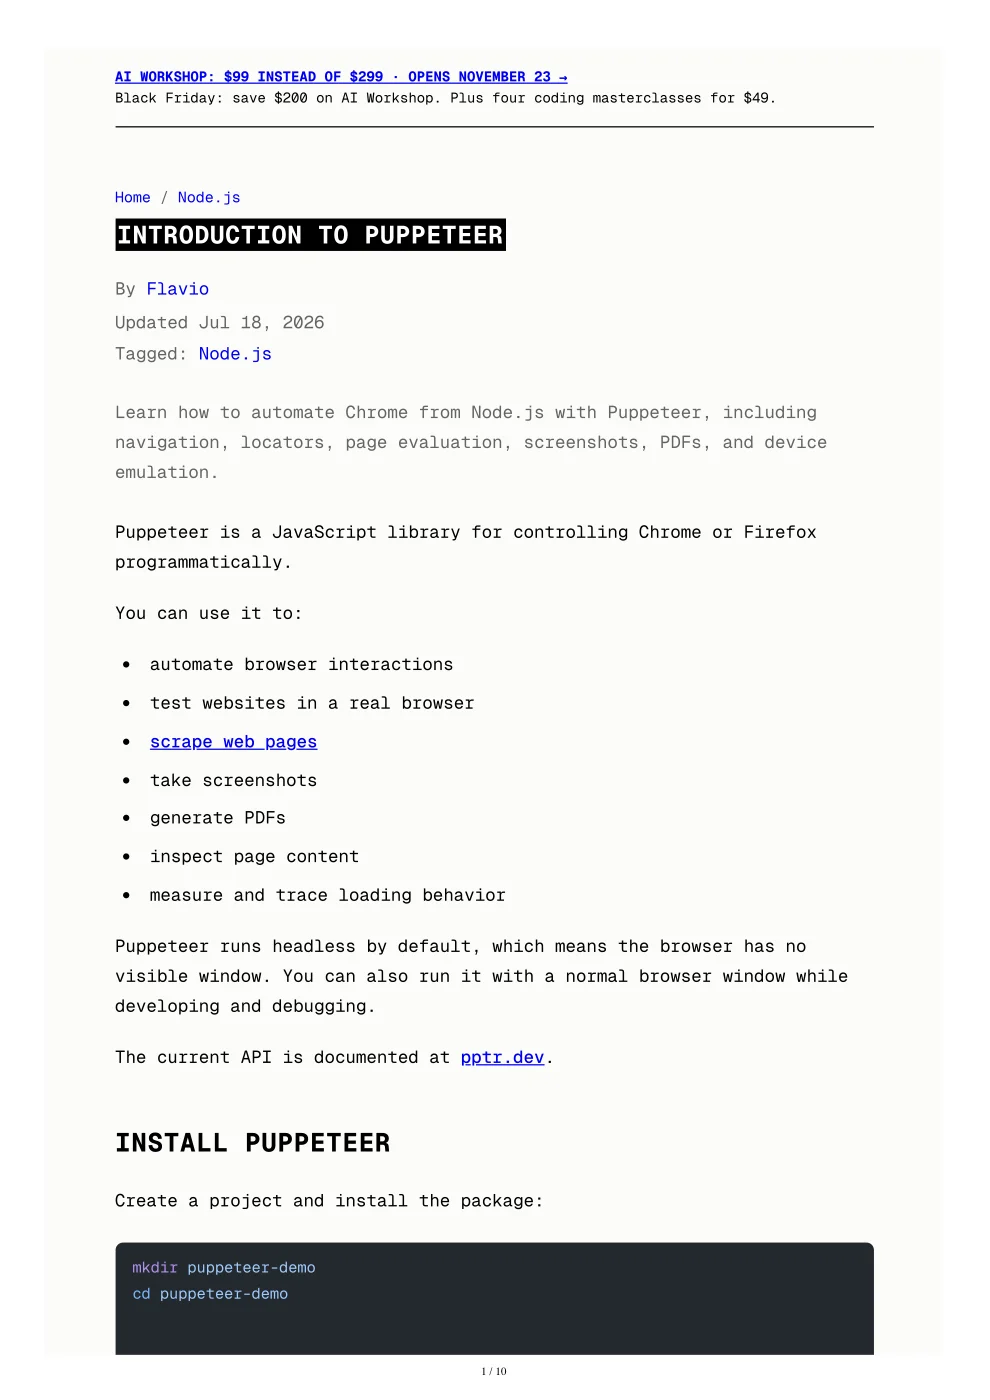
I set headerTemplate to an empty <span> because with displayHeaderFooter on, Chrome otherwise adds its default header with the date and page title. The footer template needs an explicit font-size, since the default is too small to read.
Watch network traffic
After Network.enable, Chrome reports every request in three steps:
Network.requestWillBeSentwhen the request starts, with its URL and resource typeNetwork.responseReceivedwhen the headers arrive, with the status codeNetwork.loadingFinishedwhen the body is done, with the bytes transferred
All three share a requestId, so we collect them in a map:
import { connect, newPage } from './cdp.mjs'

const browser = await connect()
const page = await newPage(browser)

const requests = new Map()

page.on('Network.requestWillBeSent', ({ requestId, request, type }) => {
  requests.set(requestId, { url: request.url, type, bytes: 0 })
})
page.on('Network.responseReceived', ({ requestId, response }) => {
  requests.get(requestId).status = response.status
})
page.on('Network.loadingFinished', ({ requestId, encodedDataLength }) => {
  requests.get(requestId).bytes = encodedDataLength
})

await page.send('Network.enable')
await page.send('Network.setCacheDisabled', { cacheDisabled: true })
await page.send('Page.enable')
await page.send('Page.setLifecycleEventsEnabled', { enabled: true })

const idle = new Promise((resolve) => {
  page.on('Page.lifecycleEvent', ({ name }) => {
    if (name === 'networkIdle') resolve()
  })
})
await page.send('Page.navigate', { url: 'https://flaviocopes.com' })
await idle

for (const { status, type, bytes, url } of requests.values()) {
  console.log(status, type.padEnd(10), String(bytes).padStart(6), url.slice(0, 60))
}

await page.close()
browser.close()
200 Document 14073 https://flaviocopes.com/
200 Stylesheet 3178 https://flaviocopes.com/pagefind/pagefind-ui.css
200 Stylesheet 19056 https://flaviocopes.com/_astro/Sponsors.CO4ocJaI.css
200 Image 8603 https://flaviocopes.com/img/favicon-96x96.png
200 Script 31444 https://flaviocopes.com/pagefind/pagefind-ui.js
200 Script 992 https://flaviocopes.com/cdn-cgi/scripts/5c5dd728/cloudflare-
200 Script 6774 https://b.flaviocopes.com/js/pa-t-Y2_teFHacUlqaVa-545.js
200 Script 10439 https://static.cloudflareinsights.com/beacon.min.js
200 Font 23653 https://flaviocopes.com/_astro/geist-mono-latin-wght-normal.
200 Script 28325 https://challenges.cloudflare.com/turnstile/v0/b/8340802ab0b
200 Document 0 https://challenges.cloudflare.com/cdn-cgi/challenge-platform
202 Fetch 523 https://b.flaviocopes.com/api/event
204 XHR 36 https://cloudflareinsights.com/cdn-cgi/rum
200 Other 1377 https://flaviocopes.com/favicon.ico
200 Other 0 https://cloudflareinsights.com/cdn-cgi/rumI added Network.setCacheDisabled after my first run, which reported 0 bytes for everything except the HTML, because the profile already had those files in its cache from earlier tests.
To read a response body, call Network.getResponseBody with the requestId after loadingFinished. It returns the body as text, or as base64 for binary files.
Block and modify requests
The Network domain only watches. To change requests, use the Fetch domain. After Fetch.enable, Chrome pauses every matching request and sends a Fetch.requestPaused event. Each paused request waits until you answer with one of these:
Fetch.continueRequestlets it through, optionally with a different URL, method, headers or bodyFetch.failRequestblocks it with a network errorFetch.fulfillRequestanswers it yourself with a status, headers and body, without hitting the network
Here we block images, fonts and anything that isn’t on flaviocopes.com, and count the requests and bytes with and without blocking:
import { connect, newPage } from './cdp.mjs'

const block = process.argv[2] === 'block'

const browser = await connect()
const page = await newPage(browser)

let requests = 0
let bytes = 0
let blocked = 0
page.on('Network.requestWillBeSent', () => requests++)
page.on('Network.loadingFinished', ({ encodedDataLength }) => { bytes += encodedDataLength })

await page.send('Network.enable')
await page.send('Network.setCacheDisabled', { cacheDisabled: true })

if (block) {
  page.on('Fetch.requestPaused', ({ requestId, request, resourceType }) => {
    const thirdParty = !new URL(request.url).hostname.endsWith('flaviocopes.com')
    if (thirdParty || resourceType === 'Image' || resourceType === 'Font') {
      blocked++
      page.send('Fetch.failRequest', { requestId, errorReason: 'BlockedByClient' })
    } else {
      page.send('Fetch.continueRequest', { requestId })
    }
  })
  await page.send('Fetch.enable', { patterns: [{ urlPattern: '*' }] })
}

await page.send('Page.enable')
await page.send('Page.setLifecycleEventsEnabled', { enabled: true })
const start = Date.now()
const idle = new Promise((resolve) => {
  page.on('Page.lifecycleEvent', ({ name, frameId }) => {
    if (name === 'networkIdle' && frameId === page.targetId) resolve()
  })
})
await page.send('Page.navigate', { url: 'https://flaviocopes.com' })
await idle

console.log({ block, requests, blocked, kb: Math.round(bytes / 1024), ms: Date.now() - start })
await page.close()
browser.close()
I ran node block.mjs and node block.mjs block three times each:
{ block: false, requests: 16, blocked: 0, kb: 145, ms: 851 }
{ block: true, requests: 12, blocked: 4, kb: 76, ms: 1110 }
{ block: false, requests: 16, blocked: 0, kb: 145, ms: 912 }
{ block: true, requests: 12, blocked: 4, kb: 76, ms: 730 }
{ block: false, requests: 16, blocked: 0, kb: 145, ms: 823 }
{ block: true, requests: 12, blocked: 4, kb: 76, ms: 734 }| Without blocking | With blocking | |
|---|---|---|
| Requests started | 16 | 12 |
| Requests blocked | 0 | 4 |
| Data transferred | 145 KB | 76 KB |
| Time to network idle | 823 to 912 ms | 730 to 1110 ms |
The 4 blocked requests still count as started. They also kept 4 others from ever starting, like the Turnstile iframe and the Cloudflare analytics calls the blocked scripts would have made. The transferred data almost halved. The timing barely changed, because networkIdle always waits 500ms of silence and my site is small. On a page full of ads and trackers, the difference is much bigger.
Every paused request needs an answer. If an exception skips the continueRequest call, that request hangs and the page never finishes loading. To pause only some requests, put a narrower urlPattern or a resourceType in patterns.
Cookies
Network.setCookie sets a cookie before you navigate, and Network.getCookies reads the cookies for the current page:
import { connect, newPage } from './cdp.mjs'

const browser = await connect()
const page = await newPage(browser)

await page.send('Network.setCookie', {
  name: 'theme',
  value: 'dark',
  domain: 'flaviocopes.com',
  path: '/',
})

await page.send('Page.enable')
const loaded = page.once('Page.loadEventFired')
await page.send('Page.navigate', { url: 'https://flaviocopes.com' })
await loaded

const { cookies } = await page.send('Network.getCookies')
console.log(cookies.map(({ name, domain }) => `${name} (${domain})`))

await page.close()
browser.close()
[ 'cf_clearance (.flaviocopes.com)', 'theme (flaviocopes.com)' ]The cf_clearance cookie came from Cloudflare Turnstile during earlier runs. The profile folder keeps cookies between runs, like a normal Chrome profile. Use a fresh --user-data-dir when you need a clean state, or Storage.clearCookies to wipe them.
Saving cookies from Network.getCookies to a file and loading them back with Network.setCookies is how you keep a login between runs.
Console messages and errors
After Runtime.enable, Chrome sends Runtime.consoleAPICalled for every console call in the page, and Runtime.exceptionThrown for uncaught errors:
import { connect, newPage } from './cdp.mjs'

const browser = await connect()
const page = await newPage(browser)

page.on('Runtime.consoleAPICalled', ({ type, args }) => {
  console.log(`[console.${type}]`, args.map((arg) => arg.value ?? arg.description).join(' '))
})
page.on('Runtime.exceptionThrown', ({ exceptionDetails }) => {
  console.log('[exception]', exceptionDetails.exception.description.split('\n')[0])
})

await page.send('Runtime.enable')
await page.send('Runtime.evaluate', {
  expression: `
    console.log('page loaded', 42)
    console.warn('this is a warning')
    setTimeout(() => { undefinedFunction() }, 0)
  `,
})

await new Promise((resolve) => setTimeout(resolve, 200))
await page.close()
browser.close()
[console.log] page loaded 42
[console.warning] this is a warning
[exception] ReferenceError: undefinedFunction is not definedNotice console.warning. CDP calls it warning, not warn, so a filter on type === 'warn' never matches.
The arguments are remote objects, like the Runtime.evaluate results. Strings and numbers have a value, and objects only have a description unless you fetch their properties. Browser-level messages, like a failed resource load or a deprecation warning, come through the Log domain as Log.entryAdded after Log.enable.
Note that Runtime.evaluate worked earlier without Runtime.enable. You only need to enable the domain for its events.
Performance metrics and CPU throttling
Performance.getMetrics returns counters from the page’s renderer. Here are a few of them after loading my homepage:
import { connect, newPage } from './cdp.mjs'

const browser = await connect()
const page = await newPage(browser)

await page.send('Performance.enable')
await page.send('Page.enable')
const loaded = page.once('Page.loadEventFired')
await page.send('Page.navigate', { url: 'https://flaviocopes.com' })
await loaded

const { metrics } = await page.send('Performance.getMetrics')
for (const { name, value } of metrics) {
  if (['Nodes', 'LayoutCount', 'RecalcStyleCount', 'ScriptDuration', 'TaskDuration', 'JSHeapUsedSize'].includes(name)) {
    console.log(name.padEnd(17), value)
  }
}

await page.close()
browser.close()
Nodes 947
LayoutCount 6
RecalcStyleCount 7
ScriptDuration 0.006223
TaskDuration 0.029736
JSHeapUsedSize 1723128Durations are in seconds. So the page ran 6ms of JavaScript and 30ms of main thread work to load, and used 1.7 MB of JavaScript heap.
To test how a page behaves on a slow phone, slow down the CPU with Emulation.setCPUThrottlingRate. A rate of 4 makes it four times slower. We’ll see it in action in the Puppeteer section.
For a full performance trace, the kind the DevTools Performance panel shows, use the Tracing domain. It streams trace events you can save as JSON and open in DevTools.
Launch Chrome from your script
So far we started Chrome by hand. Puppeteer’s launch() starts it for you, and we can do the same with child_process.spawn.
With --remote-debugging-port=0, Chrome picks a free port and prints the WebSocket URL on stderr. We read it from there, and we never collide with another browser:
import { spawn } from 'node:child_process'
import { mkdtemp } from 'node:fs/promises'
import { tmpdir } from 'node:os'
import { join } from 'node:path'
import { connect } from './cdp.mjs'

const chromePath = '/Applications/Google Chrome.app/Contents/MacOS/Google Chrome'

export async function launch() {
  const userDataDir = await mkdtemp(join(tmpdir(), 'cdp-profile-'))

  const chrome = spawn(chromePath, [
    '--headless',
    '--remote-debugging-port=0',
    `--user-data-dir=${userDataDir}`,
    '--no-first-run',
    '--no-default-browser-check',
  ])

  const url = await new Promise((resolve, reject) => {
    chrome.stderr.on('data', (chunk) => {
      const match = chunk.toString().match(/DevTools listening on (ws:\/\/\S+)/)
      if (match) resolve(match[1])
    })
    chrome.on('exit', (code) => reject(new Error(`Chrome exited with code ${code}`)))
  })

  console.log(url)
  return connect(url)
}
Save it as launch.mjs. Browser.close shuts Chrome down when we’re done:
import { launch } from './launch.mjs'

const browser = await launch()
const { product } = await browser.send('Browser.getVersion')
console.log(product)

await browser.send('Browser.close')
ws://127.0.0.1:65160/devtools/browser/5510c155-a469-4a9c-8049-f142abdc40f2
Chrome/156.0.8078.81The whole run, from spawning Chrome to closing it, took 0.53 seconds.
In a real tool you’d also kill the process if your script crashes, delete the temporary profile, and find Chrome on Linux and Windows. That’s what puppeteer.launch() does, plus downloading a known Chrome version.
Chrome also supports --remote-debugging-pipe, which talks CDP over file descriptors 3 and 4 instead of a port. No other program on the machine can connect to it. Puppeteer uses it when you pass pipe: true to launch().
Replacing Puppeteer with CDP
Puppeteer is a CDP client. A large, careful one, but every method ends up as the same JSON messages we’ve been sending.
You can see them. Puppeteer logs its protocol traffic through Node’s util.debuglog, so the NODE_DEBUG variable turns it on. Here’s a Puppeteer version of our title script, connected to the same Chrome:
import puppeteer from 'puppeteer-core'

const browser = await puppeteer.connect({ browserURL: 'http://127.0.0.1:9333' })
const page = await browser.newPage()

await page.goto('https://flaviocopes.com')
console.log(await page.title())

await page.close()
await browser.disconnect()NODE_DEBUG='puppeteer:protocol:*' node title.mjs 2> protocol.logThe log had 253 lines. These are the first ones:
PUPPETEER:PROTOCOL:SEND ► 77409: {"method":"Target.getBrowserContexts","id":1}
PUPPETEER:PROTOCOL:RECV ◀ 77409: {"id":1,"result":{"browserContextIds":[],"defaultBrowserContextId":"6ACD9EC3F08A01BD43715504A0FDBFCF"}}
PUPPETEER:PROTOCOL:SEND ► 77409: {"method":"Target.setDiscoverTargets","params":{"discover":true,"filter":[{}]},"id":2}
Older Puppeteer versions used the debug package and the DEBUG variable. With Puppeteer 25, DEBUG printed nothing and NODE_DEBUG worked.
To open a page, navigate and read the title, Puppeteer sent 42 commands. After attaching to every target it found, it sent this for the new page:
Network.enable
Page.enable
Page.getFrameTree
Page.setLifecycleEventsEnabled
Runtime.enable
Audits.enable
Performance.enable
Log.enable
WebMCP.enable
Page.addScriptToEvaluateOnNewDocument
Page.createIsolatedWorld
Emulation.setDeviceMetricsOverride
Emulation.setTouchEmulationEnabled
Page.navigate
It enables every domain it might need, creates an isolated JavaScript world so its own helpers don’t clash with the page’s code, and sets a default 800×600 viewport. page.title() became a Runtime.callFunctionOn, and page.close() a Target.closeTarget.
Our script sent 6 commands for the same job. I counted the messages in both, and timed 5 runs of each:
| Raw CDP client | puppeteer-core 25.16.0 | |
|---|---|---|
| npm packages installed | 0 | 25 |
node_modules size | 0 | 32 MB |
| Commands sent | 6 | 42 |
| Messages received | 20 | 211 |
| Time per run | 0.23 to 0.27 s | 0.29 to 0.35 s |
| Downloads a browser | No | No (puppeteer does) |
The time difference doesn’t matter much in practice, since the page load dominates. The dependency difference matters more if you ship a CLI or a small serverless function.
The full puppeteer package also downloads Chrome on install. My ~/.cache/puppeteer folder had grown to 751 MB with three browser builds: two versions of Chrome for Testing (242 MB and 325 MB) and a chrome-headless-shell (184 MB). With raw CDP you use the Chrome you already have.
Puppeteer methods and their CDP commands
Most of what you use in Puppeteer has a direct CDP equivalent:
| Puppeteer | CDP |
|---|---|
puppeteer.launch() | Spawn Chrome with --remote-debugging-port=0 |
puppeteer.connect() | GET /json/version, then a WebSocket |
browser.newPage() | Target.createTarget + Target.attachToTarget |
page.goto(url) | Page.navigate + wait for a lifecycle event |
page.evaluate(fn) | Runtime.evaluate or Runtime.callFunctionOn |
page.$(selector) | DOM.querySelector |
page.click(selector) | DOM.getBoxModel + Input.dispatchMouseEvent |
page.type(selector, text) | Input.insertText or Input.dispatchKeyEvent |
page.screenshot() | Page.captureScreenshot |
page.pdf() | Page.printToPDF |
page.setViewport() | Emulation.setDeviceMetricsOverride |
page.emulateMediaFeatures() | Emulation.setEmulatedMedia |
page.setUserAgent() | Emulation.setUserAgentOverride |
page.setRequestInterception() | Fetch.enable + Fetch.requestPaused |
page.on('console') | Runtime.consoleAPICalled |
page.on('response') | Network.responseReceived |
page.cookies() | Network.getCookies |
page.metrics() | Performance.getMetrics |
page.close() | Target.closeTarget |
browser.close() | Browser.close |
When Puppeteer is still the better choice
Each line in that table is easy. What Puppeteer adds is the work around them, and you’d have to write it yourself:
- Waiting. Locators retry until the element exists, is visible, is stable and isn’t covered by another element. Our
waitFor()only polls an expression. - Iframes from other sites. Each one runs in its own target. Puppeteer attaches to them automatically with
Target.setAutoAttachand routes commands to the right session. - Keyboard.
page.keyboard.press('ArrowDown')knows thekey,codeand key codes for every key. With CDP you look them up. - Dialogs, downloads and file uploads. They work with
Page.handleJavaScriptDialog,Browser.setDownloadBehaviorandDOM.setFileInputFiles, but you have to handle each case. - Browser versions. Puppeteer is tested against a specific Chrome, and it handles protocol changes between versions for you.
- Firefox. Puppeteer can also drive Firefox through WebDriver BiDi. CDP is Chromium only.
My advice: use raw CDP for focused jobs, like taking screenshots, printing PDFs, grabbing a value from a page, recording network traffic or checking console errors. Each of those needs only a handful of commands.
For test suites or scrapers that click through many pages, use Puppeteer or Playwright. Their waiting logic alone saves you days of flaky failures.
Mix both with createCDPSession
You don’t have to choose. page.createCDPSession() gives you a raw CDP session for a Puppeteer page, so you can call anything Puppeteer doesn’t wrap.
Here we slow the CPU down four times and time a loop in the page:
import puppeteer from 'puppeteer-core'

const browser = await puppeteer.connect({ browserURL: 'http://127.0.0.1:9333' })
const page = await browser.newPage()

const session = await page.createCDPSession()
await session.send('Emulation.setCPUThrottlingRate', { rate: 4 })

const start = Date.now()
await page.evaluate(() => {
  let n = 0
  for (let i = 0; i < 50_000_000; i++) n += i
  return n
})
console.log(`${Date.now() - start}ms`)

await page.close()
await browser.disconnect()140msWith rate: 1, the same loop took 34ms.
Playwright has the same escape hatch, page.context().newCDPSession(page), and it can attach to an existing Chrome with chromium.connectOverCDP(). That’s also how hosted browsers work. Services like Cloudflare’s Kitesurf, Browserbase and Browserless give you a CDP WebSocket URL, and you point your client at it.
CDP beyond Chrome
The protocol isn’t only for Chrome tabs.
Every Chromium-based browser speaks it, including Edge, Brave and Opera, and so do Electron apps started with --remote-debugging-port.
Node.js speaks a subset of it too. When you run node --inspect, Node opens a CDP endpoint with domains like Runtime, Debugger, Profiler and HeapProfiler. That’s how debugging Node.js in Chrome DevTools works.
I started a small script that increments a counter every 100ms:
let visits = 0
setInterval(() => visits++, 100)
globalThis.getVisits = () => visits
node --inspect=9229 server.mjsDebugger listening on ws://127.0.0.1:9229/9918442d-5b7d-4527-a207-206a91ac8dd0Node has no /json/version browser endpoint, so we take the first target from /json/list and evaluate an expression inside the running process:
const res = await fetch('http://127.0.0.1:9229/json/list')
const [target] = await res.json()

const ws = new WebSocket(target.webSocketDebuggerUrl)
ws.addEventListener('open', () => {
  ws.send(JSON.stringify({
    id: 1,
    method: 'Runtime.evaluate',
    params: { expression: 'process.version + " " + getVisits()' },
  }))
})
ws.addEventListener('message', (event) => {
  console.log(event.data)
  ws.close()
}){"id":1,"result":{"result":{"type":"string","value":"v22.23.4 20"}}}The counter was at 20, two seconds after the process started. That’s a way to inspect a live Node.js process without stopping it.
AI agents use CDP as well. The chrome-devtools-mcp server from the Chrome team gives coding agents tools to navigate, click, read console messages and record performance traces, and it sends CDP commands to Chrome under the hood. Playwright MCP does the same with Playwright. I wrote about its isolated contexts, which let one browser keep two accounts signed in.
Keep the debugging port private
Anything that can reach the debugging port controls the browser completely. It can read every cookie, run JavaScript on every open site, and read files the browser can access. There’s no authentication.
Chrome listens on 127.0.0.1 by default, not on your network. It also rejects WebSocket connections that come from web pages, which send an Origin header. Here’s what happened when I tried to connect with Origin: https://flaviocopes.com:
HTTP/1.1 403 Forbidden

Rejected an incoming WebSocket connection from the https://flaviocopes.com origin. Use the command line flag --remote-allow-origins=https://flaviocopes.com to allow connections from this origin or --remote-allow-origins=* to allow all origins.
Node.js scripts don’t send an Origin header, which is why our client connected without extra flags.
That still leaves every program running on your machine. So:
- never start Chrome with a debugging port on your everyday profile (Chrome 136 and later refuse anyway)
- don’t add
--remote-allow-origins=*unless you know which page needs to connect - don’t expose the port on a network. If you need remote access, use an SSH tunnel
- close the browser when the script is done
Find the right command
The protocol is big, and the hardest part is finding the command you need. Here’s where to look:
- The protocol viewer at chromedevtools.github.io/devtools-protocol documents every domain, command, event and type, with experimental and deprecated ones marked.
/json/protocolon your own debugging port returns the definition for the exact Chrome you’re running. That’s where my 59 domains and 674 commands came from.- The
devtools-protocolnpm package has TypeScript types for every command, generated from the same definition. Puppeteer depends on it, and it’s 3.7 MB. - Puppeteer’s protocol log. When you know how to do something in Puppeteer, run it with
NODE_DEBUG='puppeteer:protocol:*'and copy the commands it sends. - The Protocol Monitor in DevTools. Enable it under Settings, Experiments, then open it from the More tools menu. It shows every CDP message DevTools sends while you click around, and lets you send your own.
When you already know how to do something in Puppeteer, start with its log. Puppeteer has worked out the right order of commands for most tasks, and the log shows them in plain JSON.
Want me to talk about your product? You can sponsor this site.
Related posts about node: