Find the pages that lost Google clicks by comparing two periods
By Flavio
Updated
Export page clicks for two equal 28-day windows with searchglass query, join them with jq, and use impressions and position to tell why each page dropped.
Total clicks can go up while a few pages quietly lose most of theirs. On flaviocopes.com, Google clicks grew from 31,908 to 37,426 between two 28-day windows, and one post still went from 3,289 clicks to 86.
To find pages like that, we’ll export clicks per page for two periods with Searchglass, join the two files with jq, and then look at impressions and position to understand each drop.
You need Searchglass installed and signed in. Check whether Google has indexed a page covers the setup, and searchglass sites prints the property name to use in --site.
Pick two windows of the same length
Compare 28 days with 28 days. A 31-day month against a 30-day month, or a window that ends today against a full one, shows a drop that’s only the calendar.
28 days is also exactly 4 weeks, so both windows have the same number of Mondays and Saturdays. On flaviocopes.com, weekends get fewer clicks.
Search Console data arrives with a delay, so first check the last day that has data. Dates are inclusive and follow Google’s Pacific time:
searchglass query --site https://flaviocopes.com/ --start 2026-10-25 --end 2026-11-07 --dimensions date | jq -c '.rows[] | [.keys[0], .clicks]'["2026-10-25",1141]
["2026-10-26",1631]
["2026-10-27",1558]
["2026-10-28",1421]
["2026-10-29",1148]
["2026-10-30",929]
["2026-10-31",621]
["2026-11-01",848]
["2026-11-02",1187]
["2026-11-03",1114]
["2026-11-04",1146]On November 7, the last day with final data was November 4. So the recent window is October 8 to November 4, and the 28 days before it are September 10 to October 7. Both start on a Thursday.
Export clicks per page
--dimensions page gives one row per URL. --all keeps fetching until Google has no more rows, up to 100,000 by default:
searchglass query --site https://flaviocopes.com/ \
  --start 2026-09-10 --end 2026-10-07 \
  --dimensions page --all > sep.json
searchglass query --site https://flaviocopes.com/ \
--start 2026-10-08 --end 2026-11-04 \
--dimensions page --all > oct.jsonBefore you compare anything, check that each file is complete:
jq '.pagination' sep.json{
"startRow": 0,
"returnedRows": 4808,
"nextStartRow": null,
"rowLimitReached": false,
"allPagesRequested": true
}rowLimitReached: false means you have every row Google returned, 4,808 pages here and 5,304 in October. If it says true, a page missing from the file might simply be past the cut, not a page with zero clicks. More on that below.
Each row has the URL in keys, plus clicks, impressions, ctr and position. ctr is a fraction, so 0.054 is 5.4%.
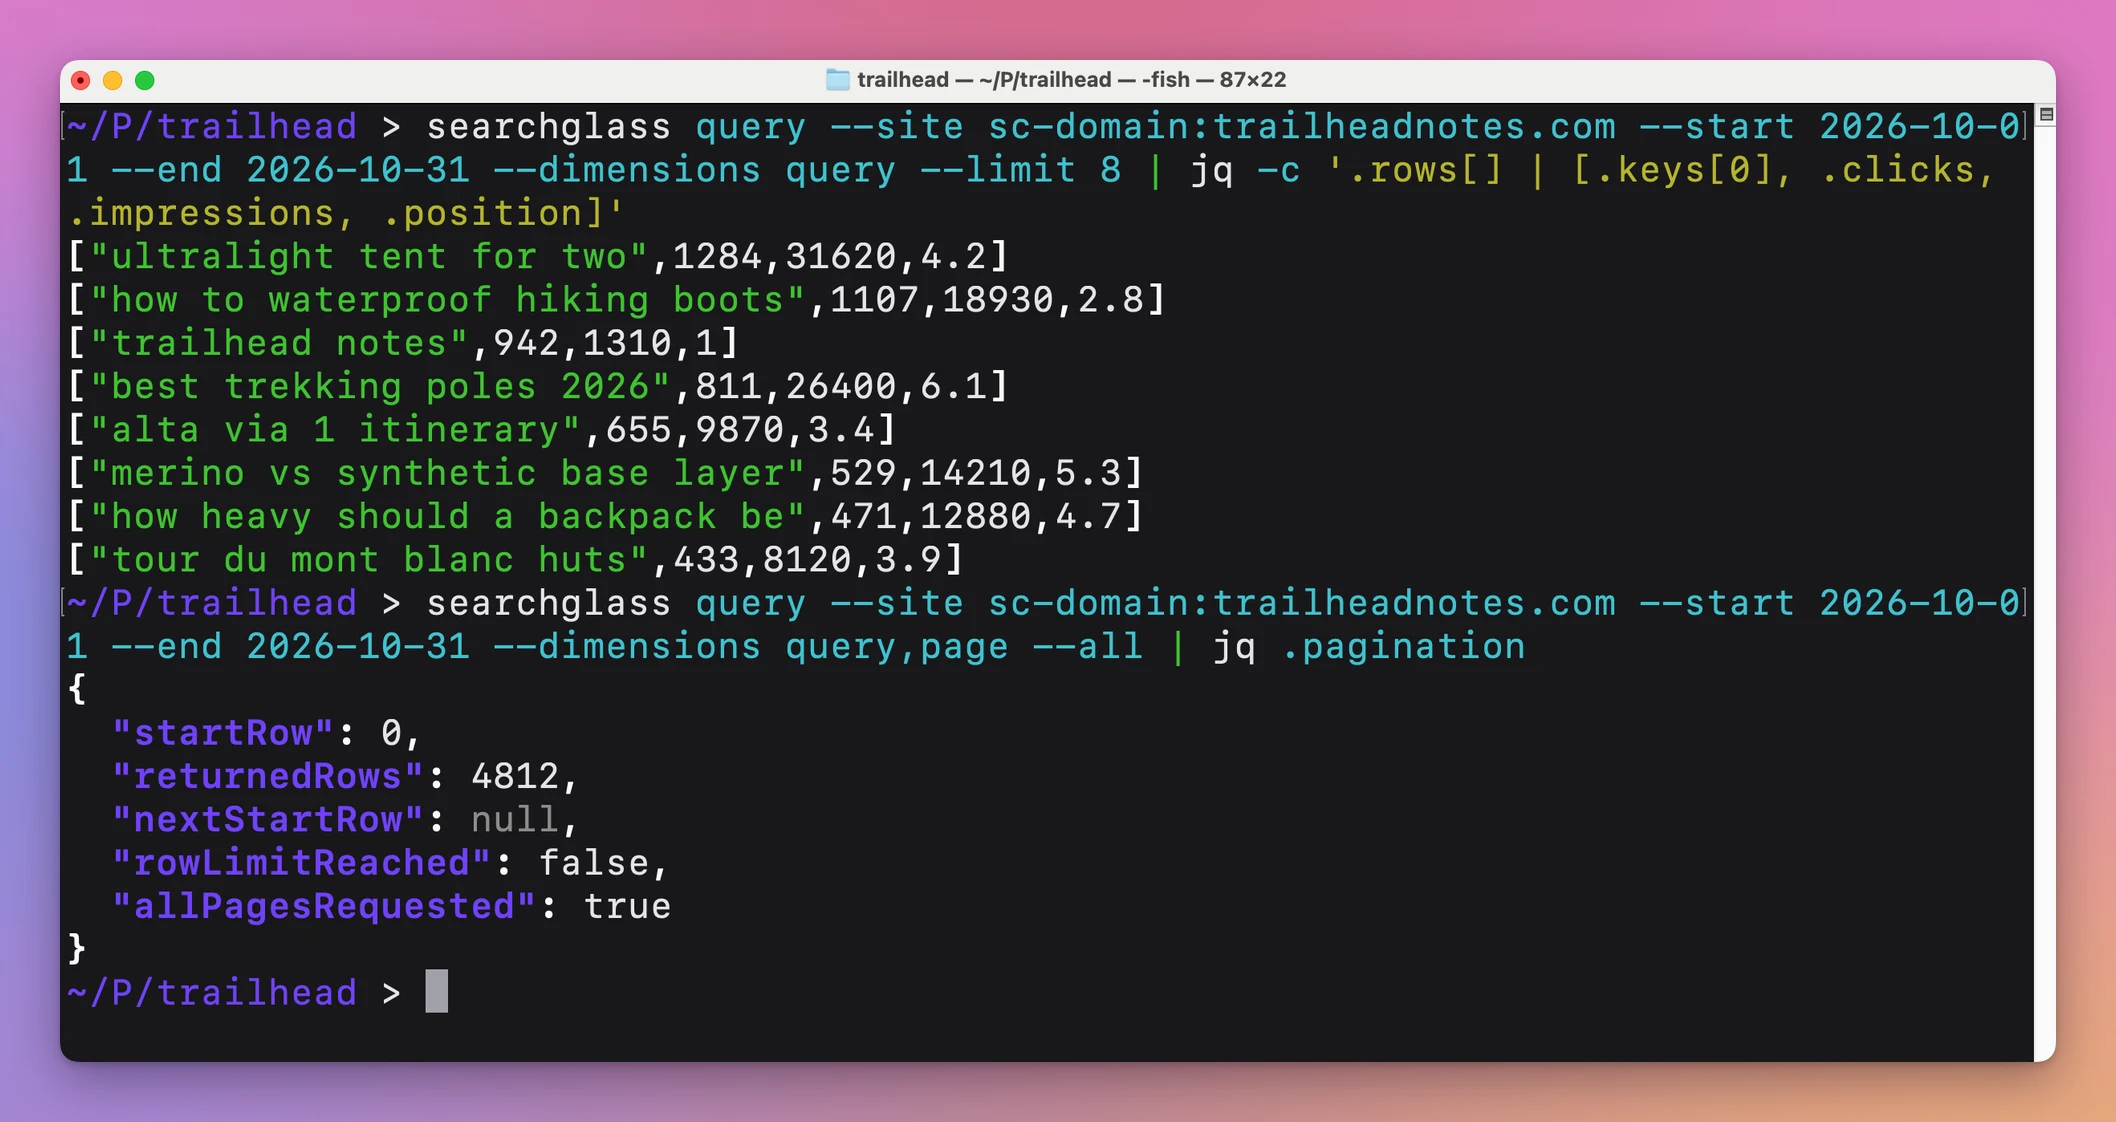
This is the same check on trailheadnotes.com, a made-up hiking blog I use for screenshots. Its query and page export ends with rowLimitReached: false:
Join the two files
This jq command builds a map of URL to clicks for each period, subtracts, and prints the 8 biggest losses:
jq -r -n --slurpfile a sep.json --slurpfile b oct.json '
  ($a[0].rows | map({(.keys[0]): .clicks}) | add) as $before
  | ($b[0].rows | map({(.keys[0]): .clicks}) | add) as $after
  | ($before | keys) + ($after | keys) | unique
  | map({page: ., before: ($before[.] // 0), after: ($after[.] // 0)})
  | map(.change = .after - .before)
  | sort_by(.change) | .[:8][]
  | "\(.change)\t\(.before)\t\(.after)\t\(.page)"'
-3203 3289 86 https://flaviocopes.com/jev/
-864 1431 567 https://flaviocopes.com/jev-api-key/
-825 1874 1049 https://flaviocopes.com/herdr/
-414 728 314 https://flaviocopes.com/gpt-6-1-sol/
-372 477 105 https://flaviocopes.com/codex/
-196 361 165 https://flaviocopes.com/slop-grenades/
-179 849 670 https://flaviocopes.com/exit-herdr/
-161 446 285 https://flaviocopes.com/herdr-plugins/A page that exists in only one file counts as 0 in the other, thanks to // 0.
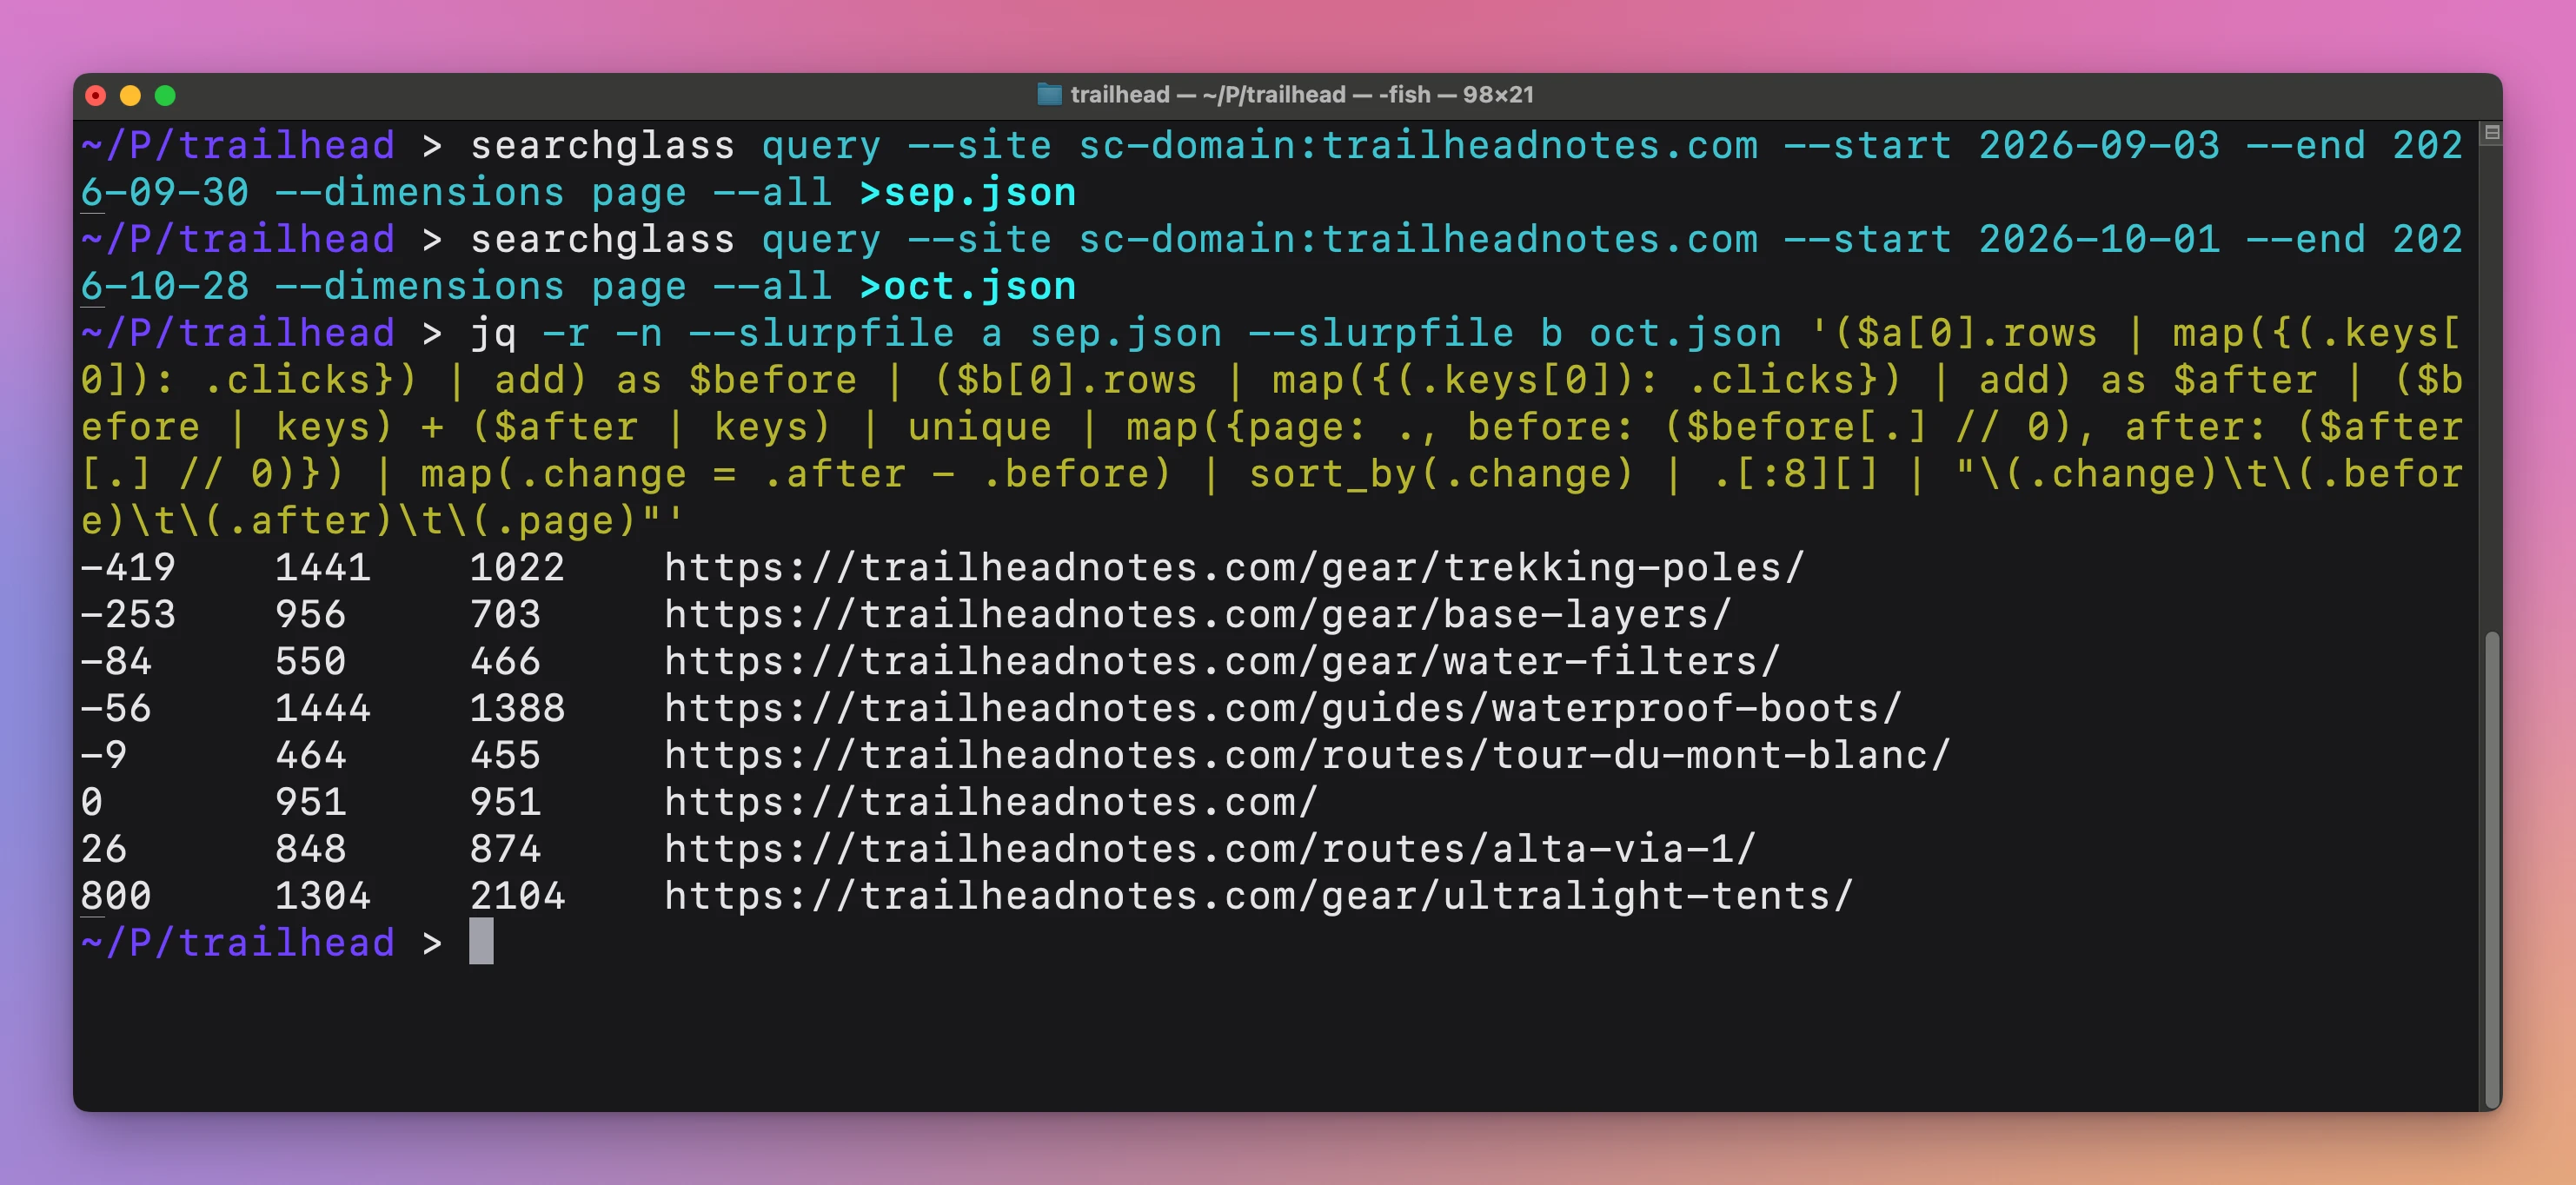
Here are the two exports and the join on the made-up hiking blog, comparing September 3 to 30 with October 1 to 28. The trekking poles page lost 419 clicks, while the ultralight tents page gained 800:
If you’d rather click, Search Console’s Performance report can compare two periods too. In the date filter pick Compare, then open the Pages tab, and each page shows its clicks for both periods. The table stops at 1,000 rows, so for a big site the export is the way to see every page.
For the site total, run the query without --dimensions instead of adding up these rows. The page rows of September add up to 31,989 clicks, while the property total for the same dates is 31,908.
Read impressions and position next to clicks
The click drop says that something changed. Impressions and position tell you what. Here are four of those pages in both windows:
| Page | Clicks | Impressions | CTR | Avg. position |
|---|---|---|---|---|
/jev/ | 3,289 → 86 | 441,270 → 17,855 | 0.7% → 0.5% | 8.0 → 8.6 |
/jev-api-key/ | 1,431 → 567 | 26,560 → 20,262 | 5.4% → 2.8% | 4.5 → 4.5 |
/herdr/ | 1,874 → 1,049 | 309,648 → 189,594 | 0.6% → 0.6% | 5.8 → 5.7 |
/codex/ | 477 → 105 | 84,075 → 167,597 | 0.6% → 0.1% | 7.3 → 9.5 |
Each line is a different story:
/jev/and/herdr/kept their position and their click-through rate. Impressions fell, so fewer people searched for those topics./jev-api-key/kept the same position and most of its impressions, but the click-through rate halved. Same rank, fewer people clicking./codex/doubled its impressions and slid from 7.3 to 9.5. It started showing for broader searches, lower on the page, where almost nobody clicks.
Only the last two are something a page edit might fix.
Check if it was a spike
A news post can lose most of its clicks just because the news got old. Filter one page and group by date to see its shape:
searchglass query --site https://flaviocopes.com/ \
  --start 2026-09-10 --end 2026-11-04 --dimensions date \
  --filter '{"dimension":"page","operator":"equals","expression":"https://flaviocopes.com/jev/"}' \
  | jq -r '.rows[] | [.keys[0], .clicks] | @tsv'
These are some of the lines it printed:
2026-09-16	0
2026-09-17	285
2026-09-18	936
2026-09-19	556
2026-09-20	350
2026-09-21	409
2026-09-22	306
2026-09-23	136
2026-09-24	89
2026-09-25	43
...
2026-11-02	0
2026-11-03	2
2026-11-04	1
The post went up on September 17, peaked the next day, and was down to a few clicks a day within two weeks. It’s still indexed, and searchglass inspect says so. There’s nothing to fix there.
Look at the search terms of one page
For /jev-api-key/, the position didn’t move but clicks did. Group by query with the same page filter, once per window:
searchglass query --site https://flaviocopes.com/ \
  --start 2026-09-10 --end 2026-10-07 --dimensions query \
  --filter '{"dimension":"page","operator":"equals","expression":"https://flaviocopes.com/jev-api-key/"}' \
  --all > terms-sep.json
Run it again with --start 2026-10-08 --end 2026-11-04 into terms-oct.json. Then print the top term of each file, with the click-through rate as a percentage:
jq -r '.rows[0] | [.keys[0], .clicks, .impressions, (.ctr * 1000 | round / 10), (.position * 10 | round / 10)] | @tsv' terms-sep.json terms-oct.jsonjev api key 344 3557 9.7 2.7
jev api key 149 2633 5.7 2.6The page sits at position 2.7 for its main search in both windows, and the click-through rate went from 9.7% to 5.7%. The rank is fine. What changed is the results page around it, or how many people click any result at all, and Search Console can’t tell you which. Search for the term yourself and look at what shows up above you.
Notice how much the term rows leave out:
jq '[.rows[].clicks] | add' terms-sep.json terms-oct.json856
348The page had 1,431 clicks in September, but its search terms add up to 856. Google hides rare searches to protect privacy, and here that’s about 40% of the clicks. Pagination can’t get them back, so a term that “disappeared” may just have dropped below that threshold.
When the file stops at 100,000 rows
Page rows were well under the limit for this site. Query and page together are not:
searchglass query --site https://flaviocopes.com/ \
  --start 2026-10-08 --end 2026-11-04 \
  --dimensions query,page --all > queries.json
jq '.pagination' queries.json
{
"startRow": 0,
"returnedRows": 100000,
"nextStartRow": 100000,
"rowLimitReached": true,
"allPagesRequested": true
}--all stopped at its default budget. Raise it with --max-rows:
searchglass query --site https://flaviocopes.com/ \
  --start 2026-10-08 --end 2026-11-04 \
--dimensions query,page --all --max-rows 500000 > queries.json| Run | Rows | rowLimitReached | File size | Time |
|---|---|---|---|---|
--all | 100,000 | true | 21 MB | 27 s |
--all --max-rows 500000 | 127,855 | false | 27 MB | 37 s |
You can also continue from where it stopped with --start-row 100000, but then you have two files to merge. For a one-off comparison, a bigger budget is simpler.
Let an agent do the comparison
Searchglass comes with an agent skill that explains these same rules to Codex, Claude Code or Cursor: equal windows, rowLimitReached, and why term rows don’t add up to the page total.
searchglass skill install --target claudeUse --target codex or --target cursor for the others, and restart the agent so it picks the skill up. Then you can ask in plain words:
Compare the last two complete 28-day periods for https://flaviocopes.com/. Find the pages that lost the most clicks, check their impressions, position and search terms, and tell me which drops a page edit could fix.
The agent runs the same searchglass query commands you saw here. Read the files it used before you change a page, because the numbers only show clicks, impressions and position, not the reason behind them.
Get Searchglass
Query Google Search Console performance, sitemaps and URL index status from your terminal or coding agent. Includes an installer, agent skill and full MIT source.
See Searchglass → · Read the docs · $20. See the app page for tax details, with full source code.
Want me to talk about your product? You can sponsor this site.