
An app by Flavio
Options Profit Calculator
Type the legs and the premiums from your broker and see the profit or loss at expiry and before it, with max profit, max loss, break-evens and the Greeks, on your Mac with nothing fetched.
Buy Options Profit Calculator · $19One-time purchase. Plus tax where it applies.
macOS 14 or later · Apple silicon and Intel
Latest version 1.0.1, released November 22, 2026
You’re looking at an iron condor on a stock trading at 187.40. Four legs, four premiums from the broker’s quote screen. Before you place it, you want the plain numbers: how much comes in, how much you can lose, and between which two prices it makes money at expiry.
You can work that out on paper. Then you change one strike, and you work it out again. And the question of how the position should look two weeks before expiry is a Black–Scholes calculation per leg, which nobody does on paper.
Options Profit Calculator does it as you type. Pick a strategy or add the legs one by one, type the premiums you were quoted, and the chart, max profit, max loss and break-evens update with every number you change. Positions are files you save, so you can open them again, duplicate them, and compare two side by side.
A calculator for your own numbers, not financial advice. Everything stays on your Mac: no market data, no account, no broker connection. The position in the screenshots is an example with made-up prices, not a suggestion to trade it.
Who it’s for
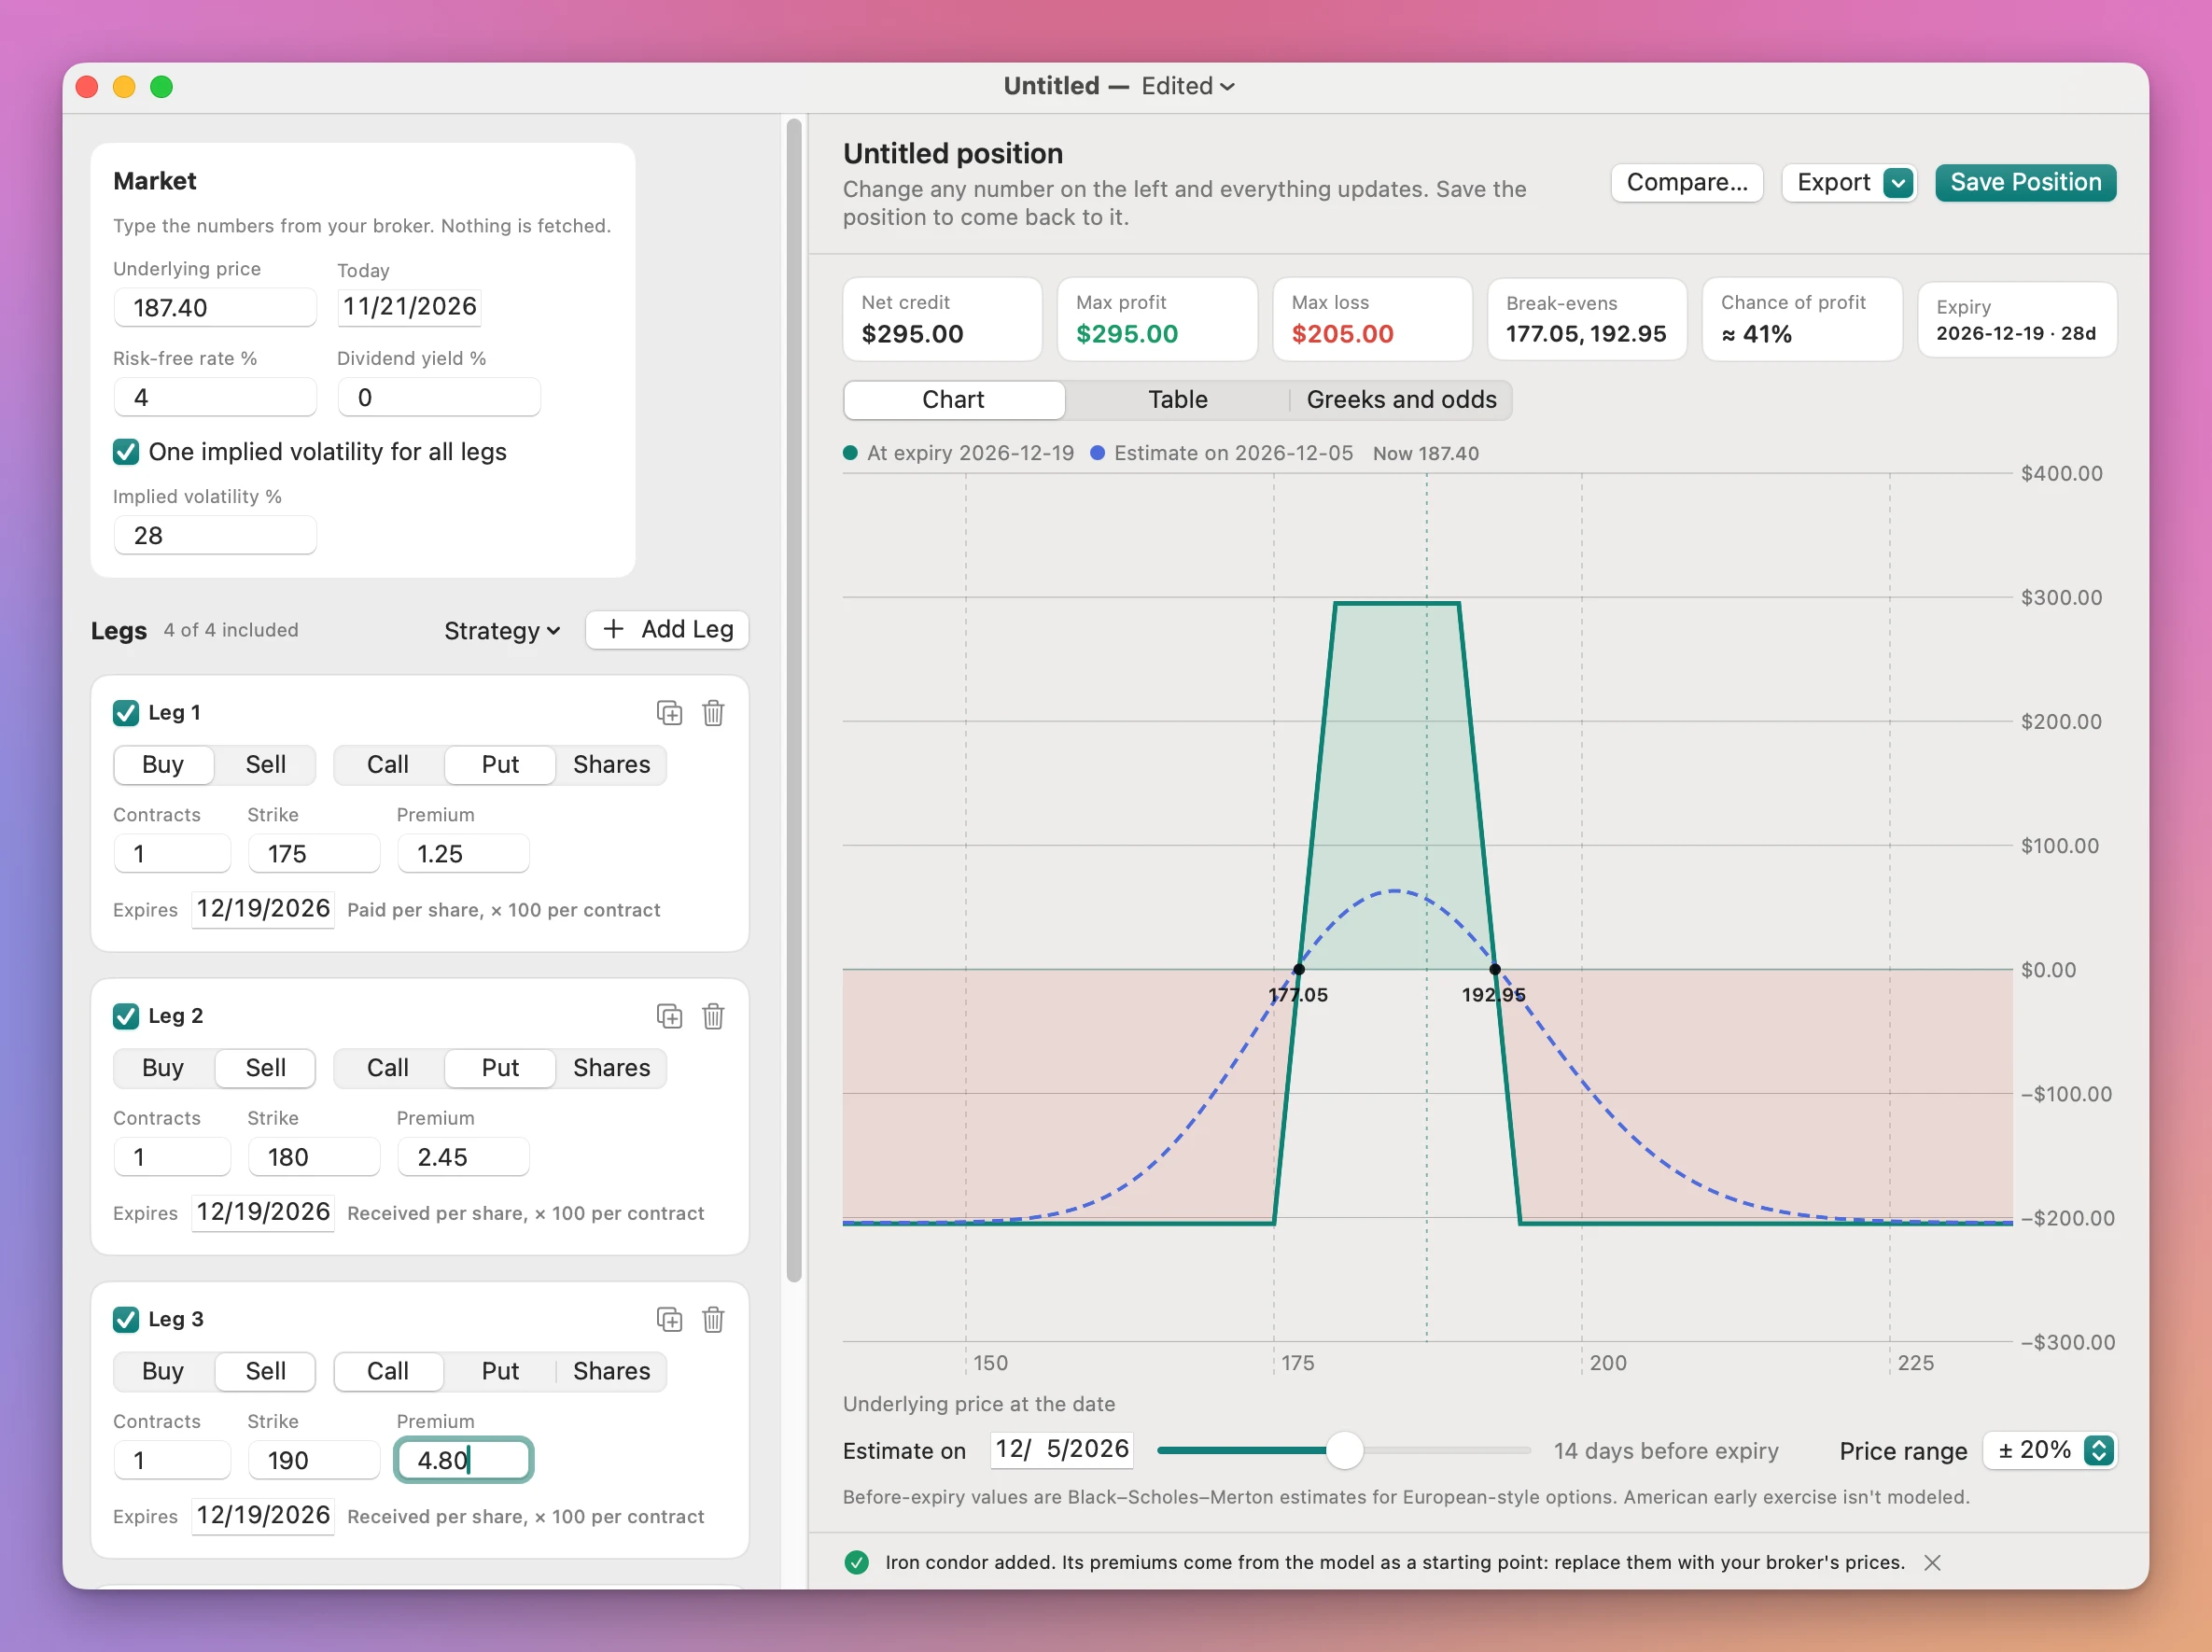
- Someone weighing an iron condor before placing it. The stock is at 187.40. You want to see the break-evens (177.05 and 192.95 with the premiums in the screenshot), the $205 max loss, and the estimate two weeks before expiry, with your broker’s prices and not a website’s.
- Covered call writers choosing a strike. You own 100 shares and you’re torn between the 190 and the 195 call. Save one, use File › Duplicate, change the strike, save, then Compare… shows both lines on one chart with max profit, break-even and the model’s chance of profit in a table.
- Cash-secured put sellers. The broker quotes a premium on a put below the price. You want the break-even, the cash to set aside to buy the shares at the strike, and the model’s estimate of the chance the put expires worthless.
- People learning options. You want to see what a straddle or a vertical spread looks like at expiry, and how the dashed estimate creeps toward it as you drag the date slider closer, with delta, gamma, theta, vega and rho explained in one sentence each.
- Teachers and bloggers. You need a clean payoff chart for a handout or a post. Export › Chart as PNG… saves a 2400×1440 image with the legs, the numbers and the model note on it, and Table as CSV… saves the profit table.
From four premiums to a payoff chart
- Type the market. In the Market card, type the Underlying price, the Risk-free rate %, the Dividend yield % and an Implied volatility %. Today is today’s date, and you can change it to look back. Nothing is fetched: these are the numbers you see at your broker.
- Pick a strategy. A new window shows Build a position with 14 strategy cards, each with a small drawing of its payoff: long and short calls and puts, covered call, cash-secured put, the four vertical spreads, iron condor, iron butterfly, long straddle and long strangle. Set Expiry for the new legs first. The strikes are placed around the price you typed.
- Replace the premiums with your broker’s. A template fills the premiums from the model as a starting point. Type the prices you were quoted into each leg’s Premium. Each leg card has Buy or Sell, Call, Put or Shares, Contracts, Strike and Expires, and says “Paid per share” or “Received per share, × 100 per contract”, so you know which way the money goes.
- Read the numbers. The pills on the right show Net credit or Net debit, Max profit, Max loss (“Unlimited” when it is), Break-evens, Chance of profit and the days to Expiry. Change any number on the left and they update.
- Look at the chart, the table and the Greeks. Three tabs: Chart, Table and Greeks and odds.
- Save the position. Click Save Position (Command-S). It’s a
.optionspositionfile you can double-click later.
To build a position by hand instead, click Add Leg (Shift-Command-L) and type each leg. The Strategy menu replaces the legs with a template after asking, and Edit › Undo brings the old ones back.
What you get
Expiry exact, before expiry estimated
The solid line is the profit or loss at expiry, worked out exactly from the strikes and premiums. The dashed line is the model’s estimate on the date you pick under the chart, with Estimate on and a slider (“14 days before expiry”). Hover anywhere on the chart to read both values at that price. Price range zooms out from ± 10% to ± 80% around the price now.
The estimate uses Black–Scholes–Merton for European-style options with a continuous dividend yield. The pricing is checked against published textbook examples. American early exercise isn’t modeled, and the app says so under the chart.
A profit table by price and date
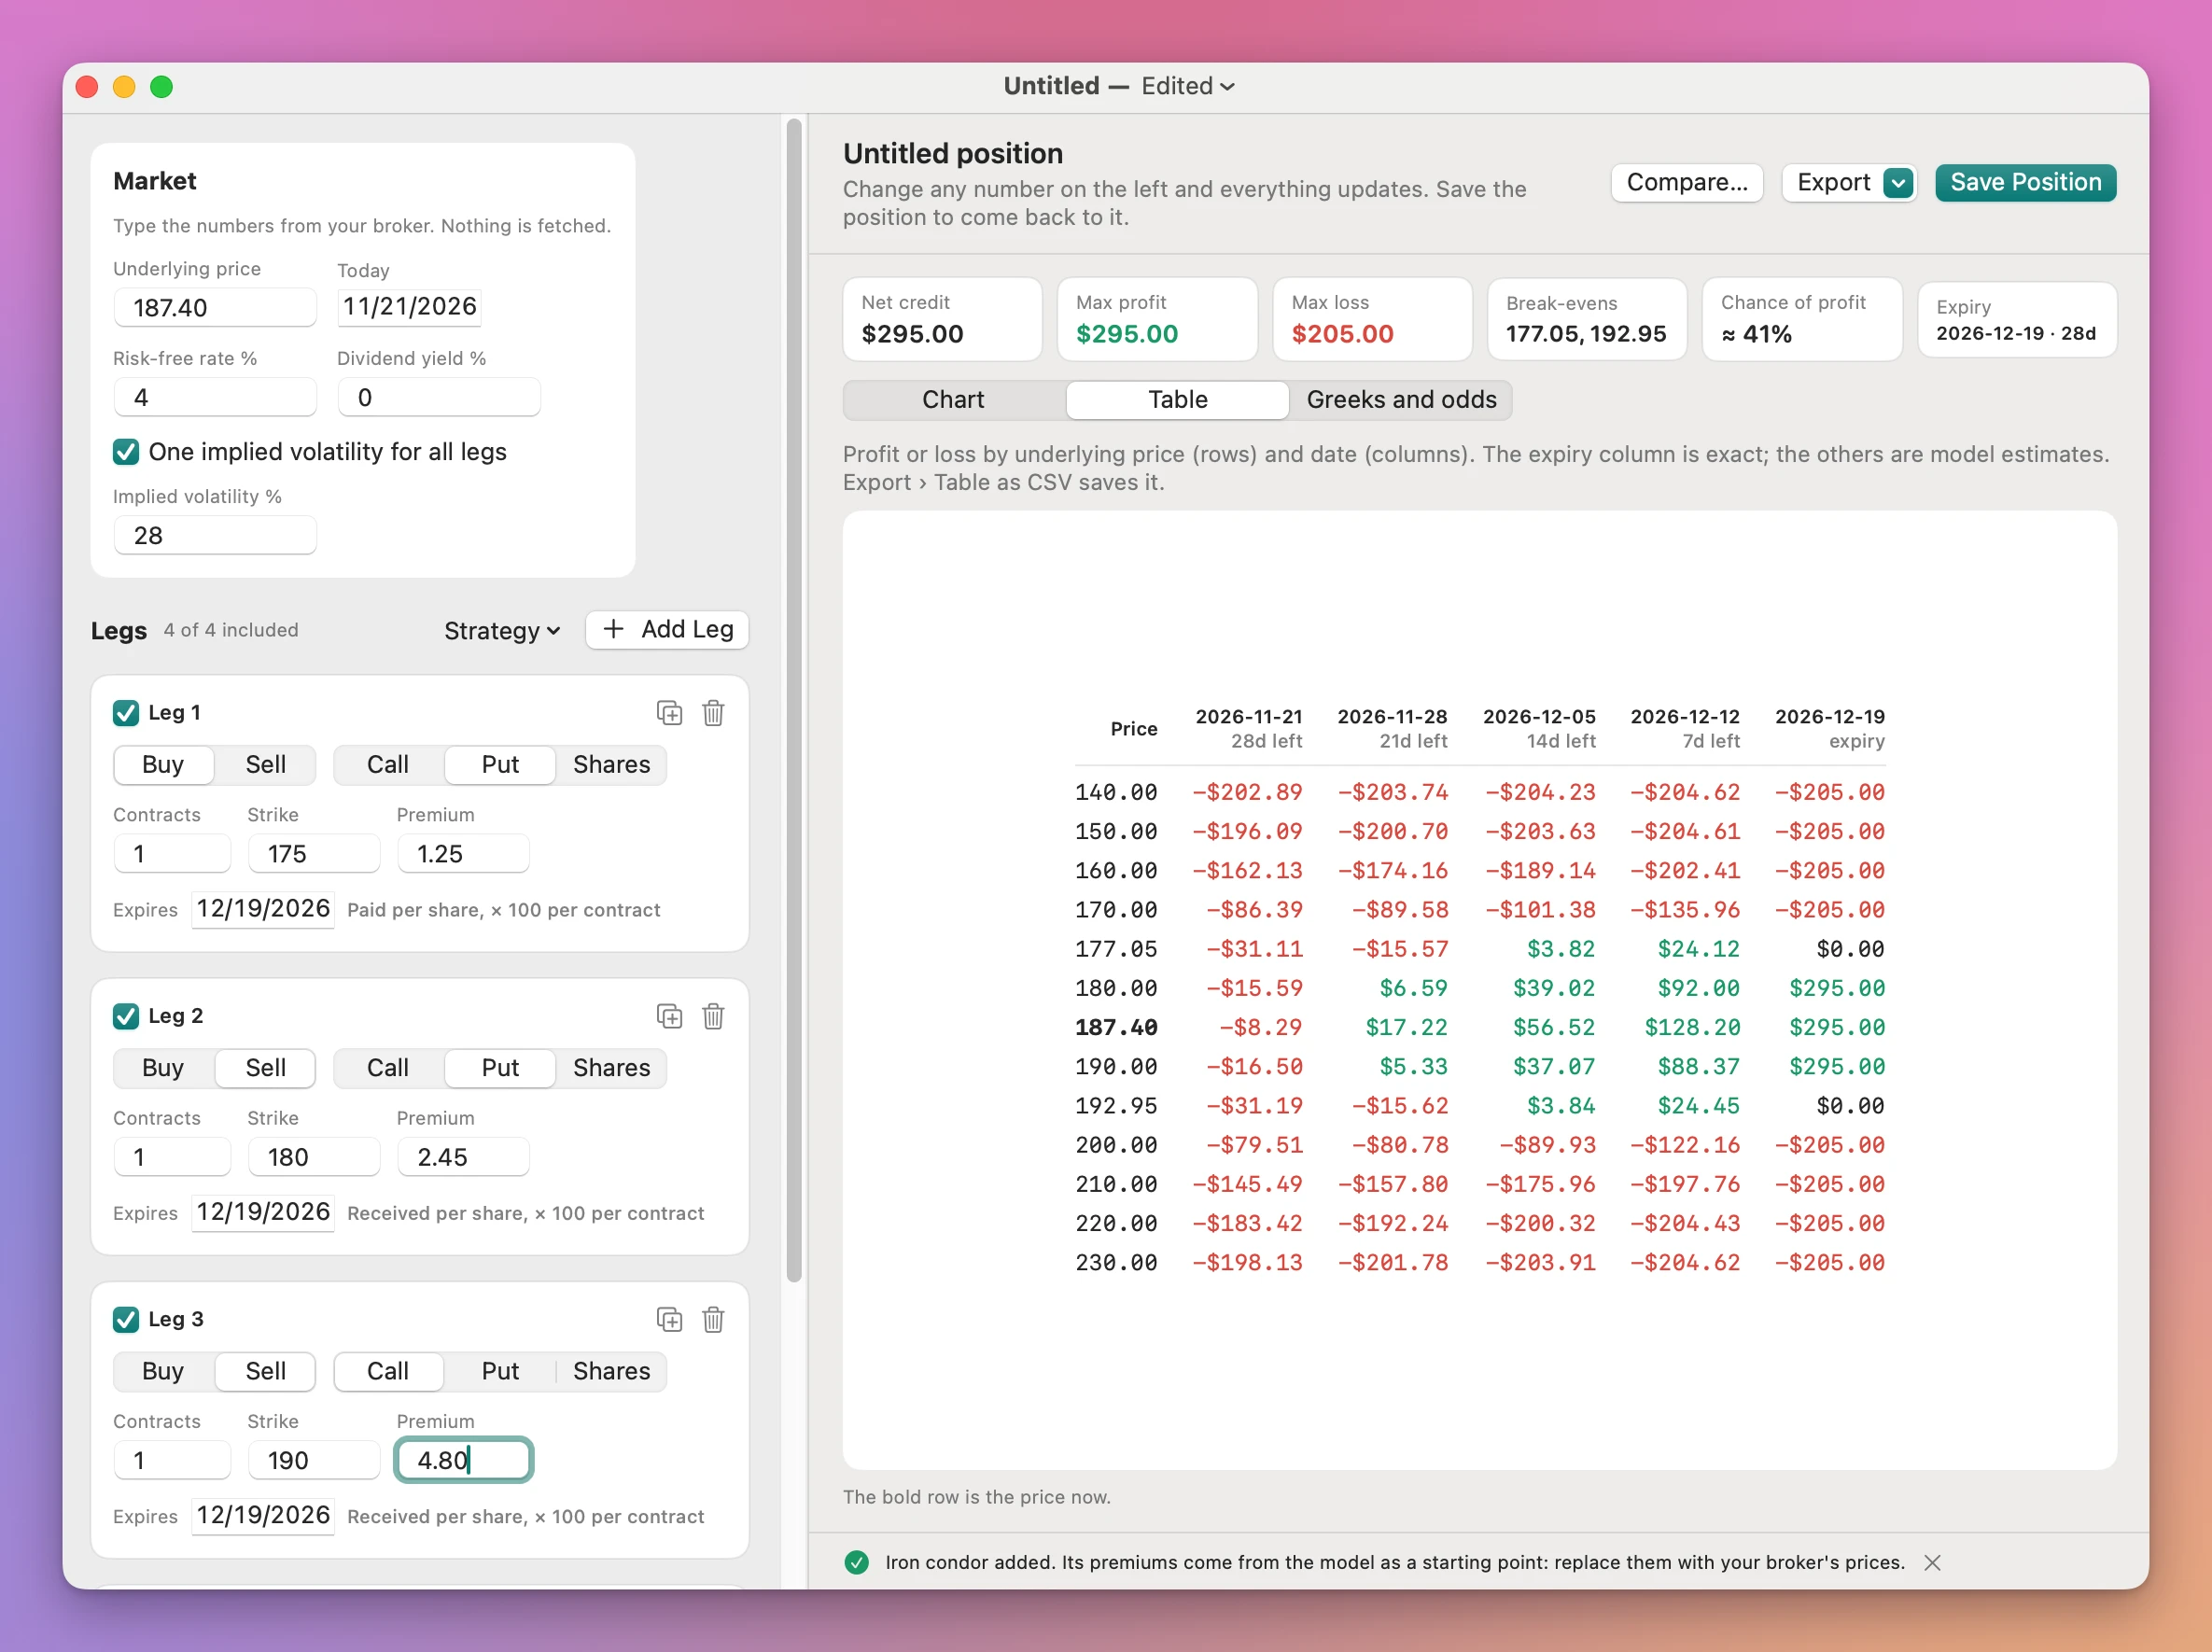
The Table tab lists the profit or loss at round prices plus the price now and the break-evens, for today, three dates in between, the date you picked and expiry. The expiry column is exact, the others are estimates. The price now is in bold.
The Greeks in plain words
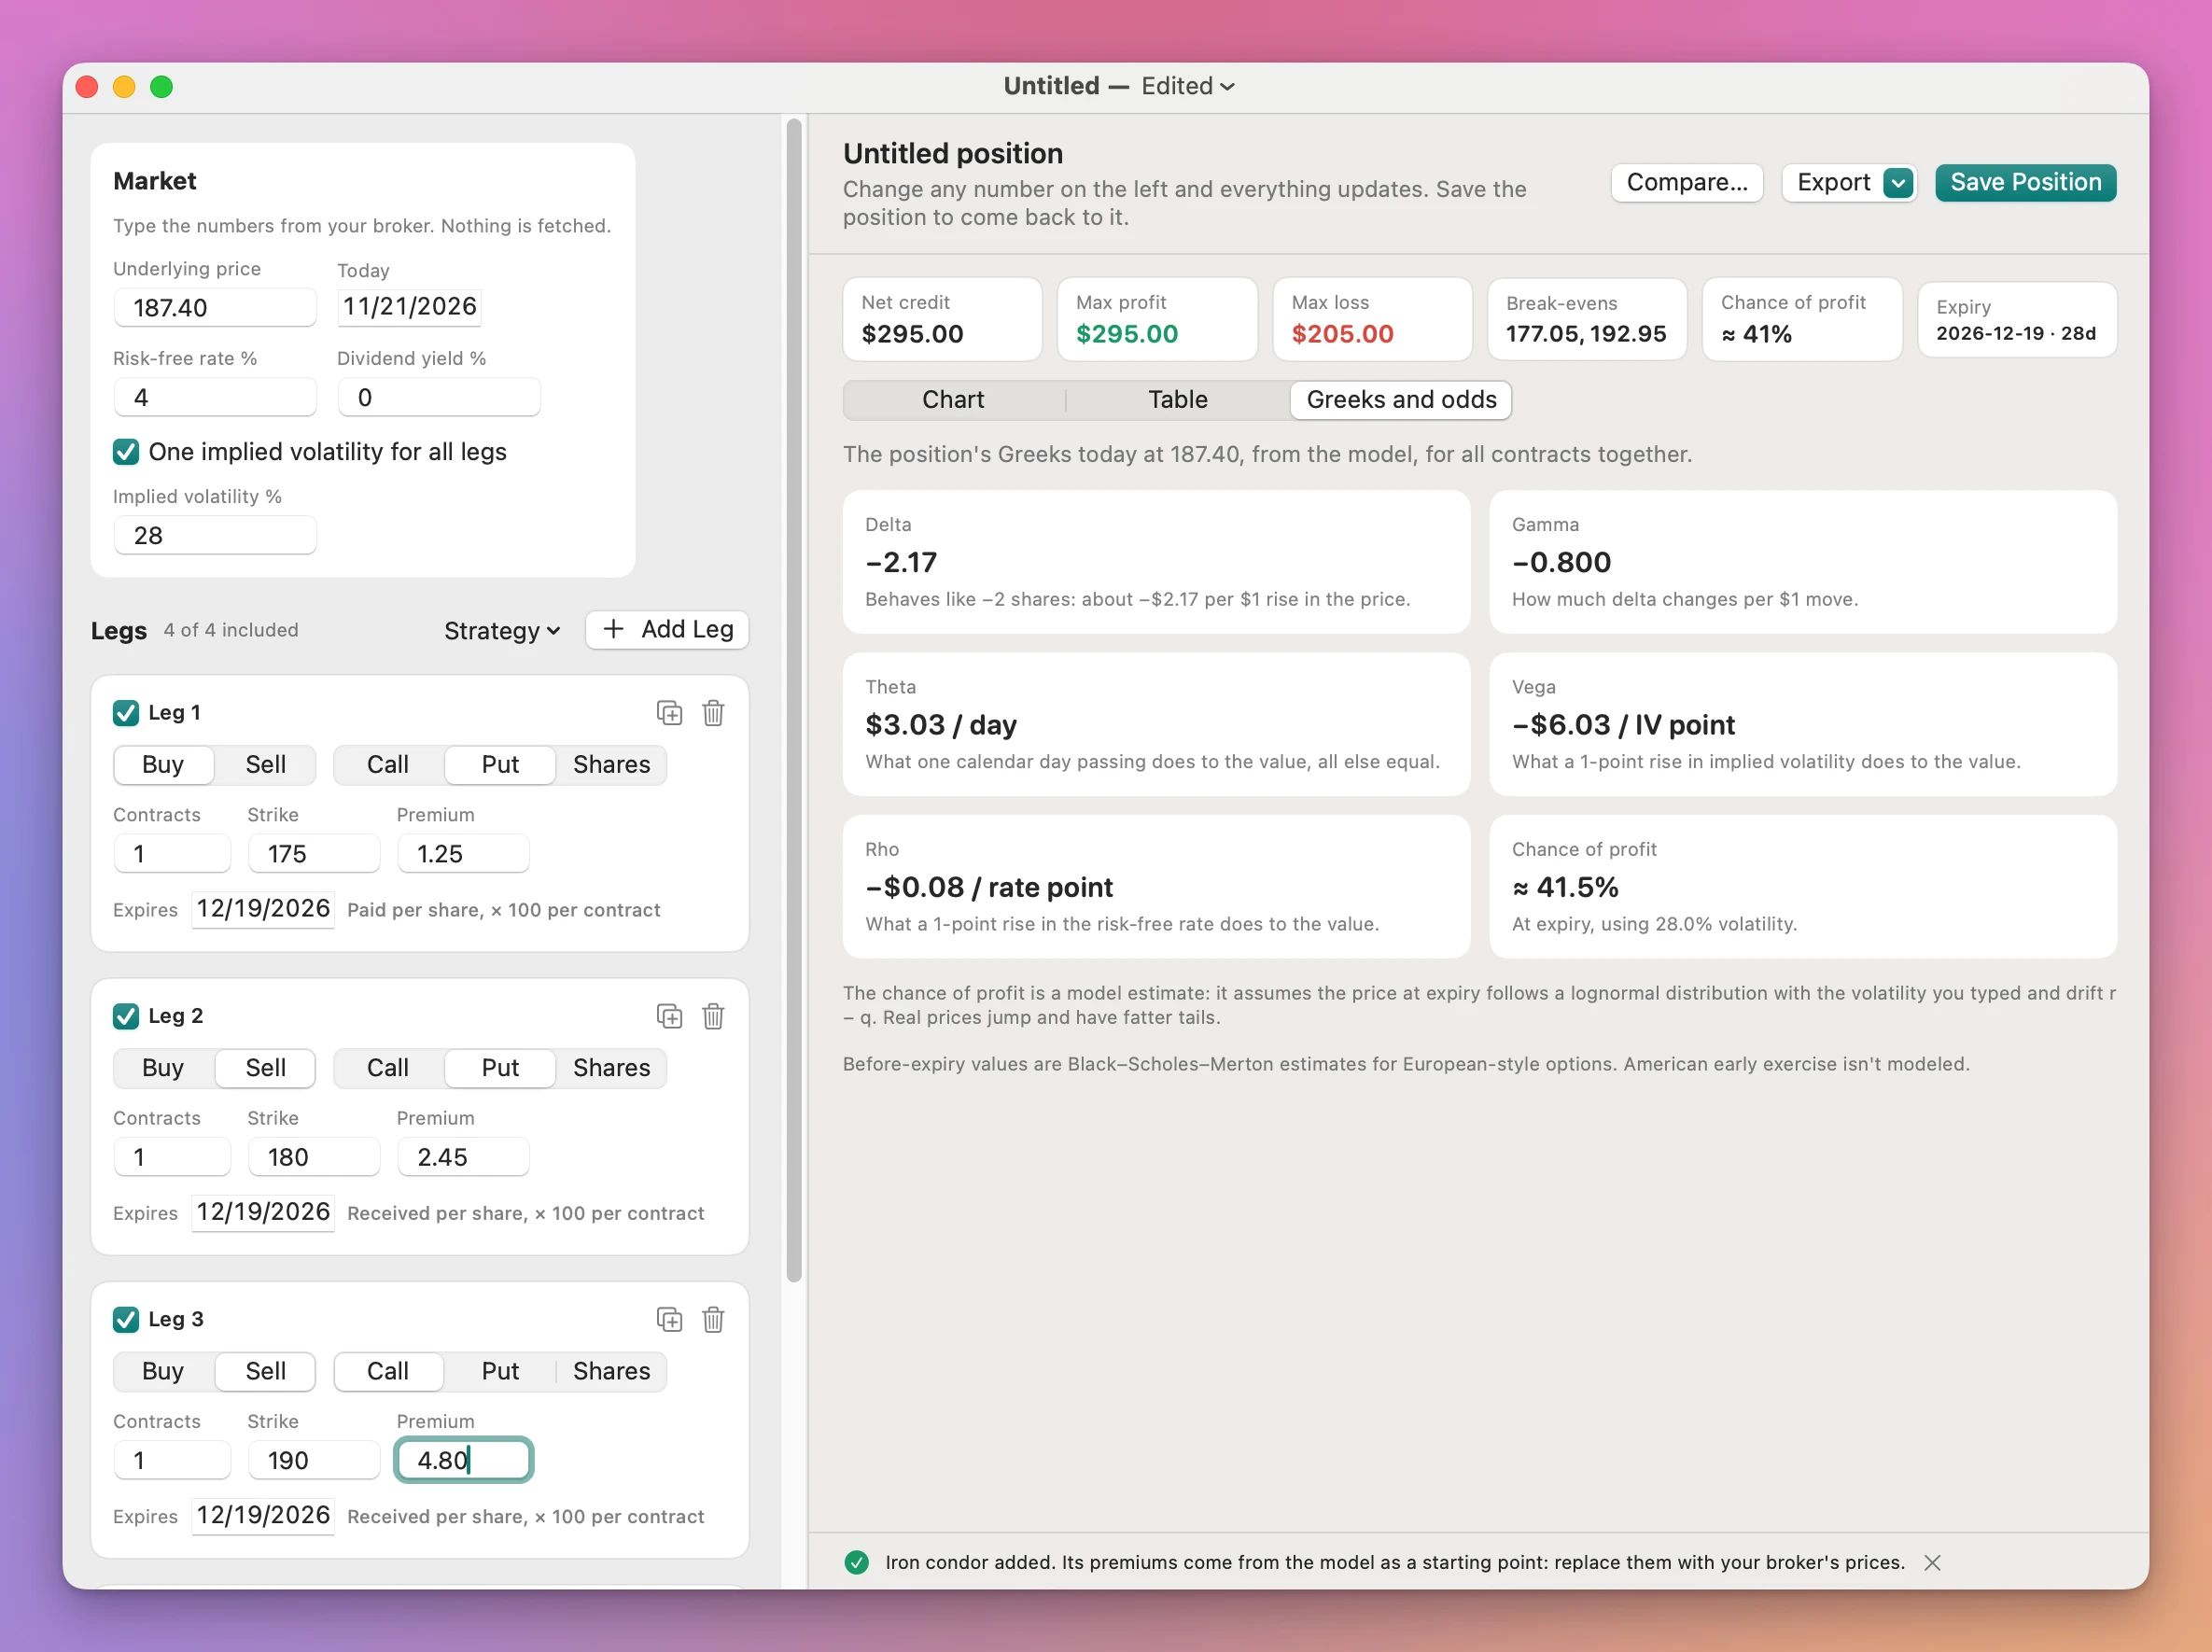
The Greeks and odds tab shows the whole position’s delta (in shares), gamma, theta per day, vega per IV point and rho per rate point, each with a line that says what it means: “Behaves like −2 shares”, “What one calendar day passing does to the value, all else equal”. For a cash-secured put it also shows the cash to set aside.
Chance of profit is a model estimate, and the tab says what it assumes: the price at expiry follows a lognormal distribution with the volatility you typed. Real prices jump and have fatter tails.
Two positions side by side
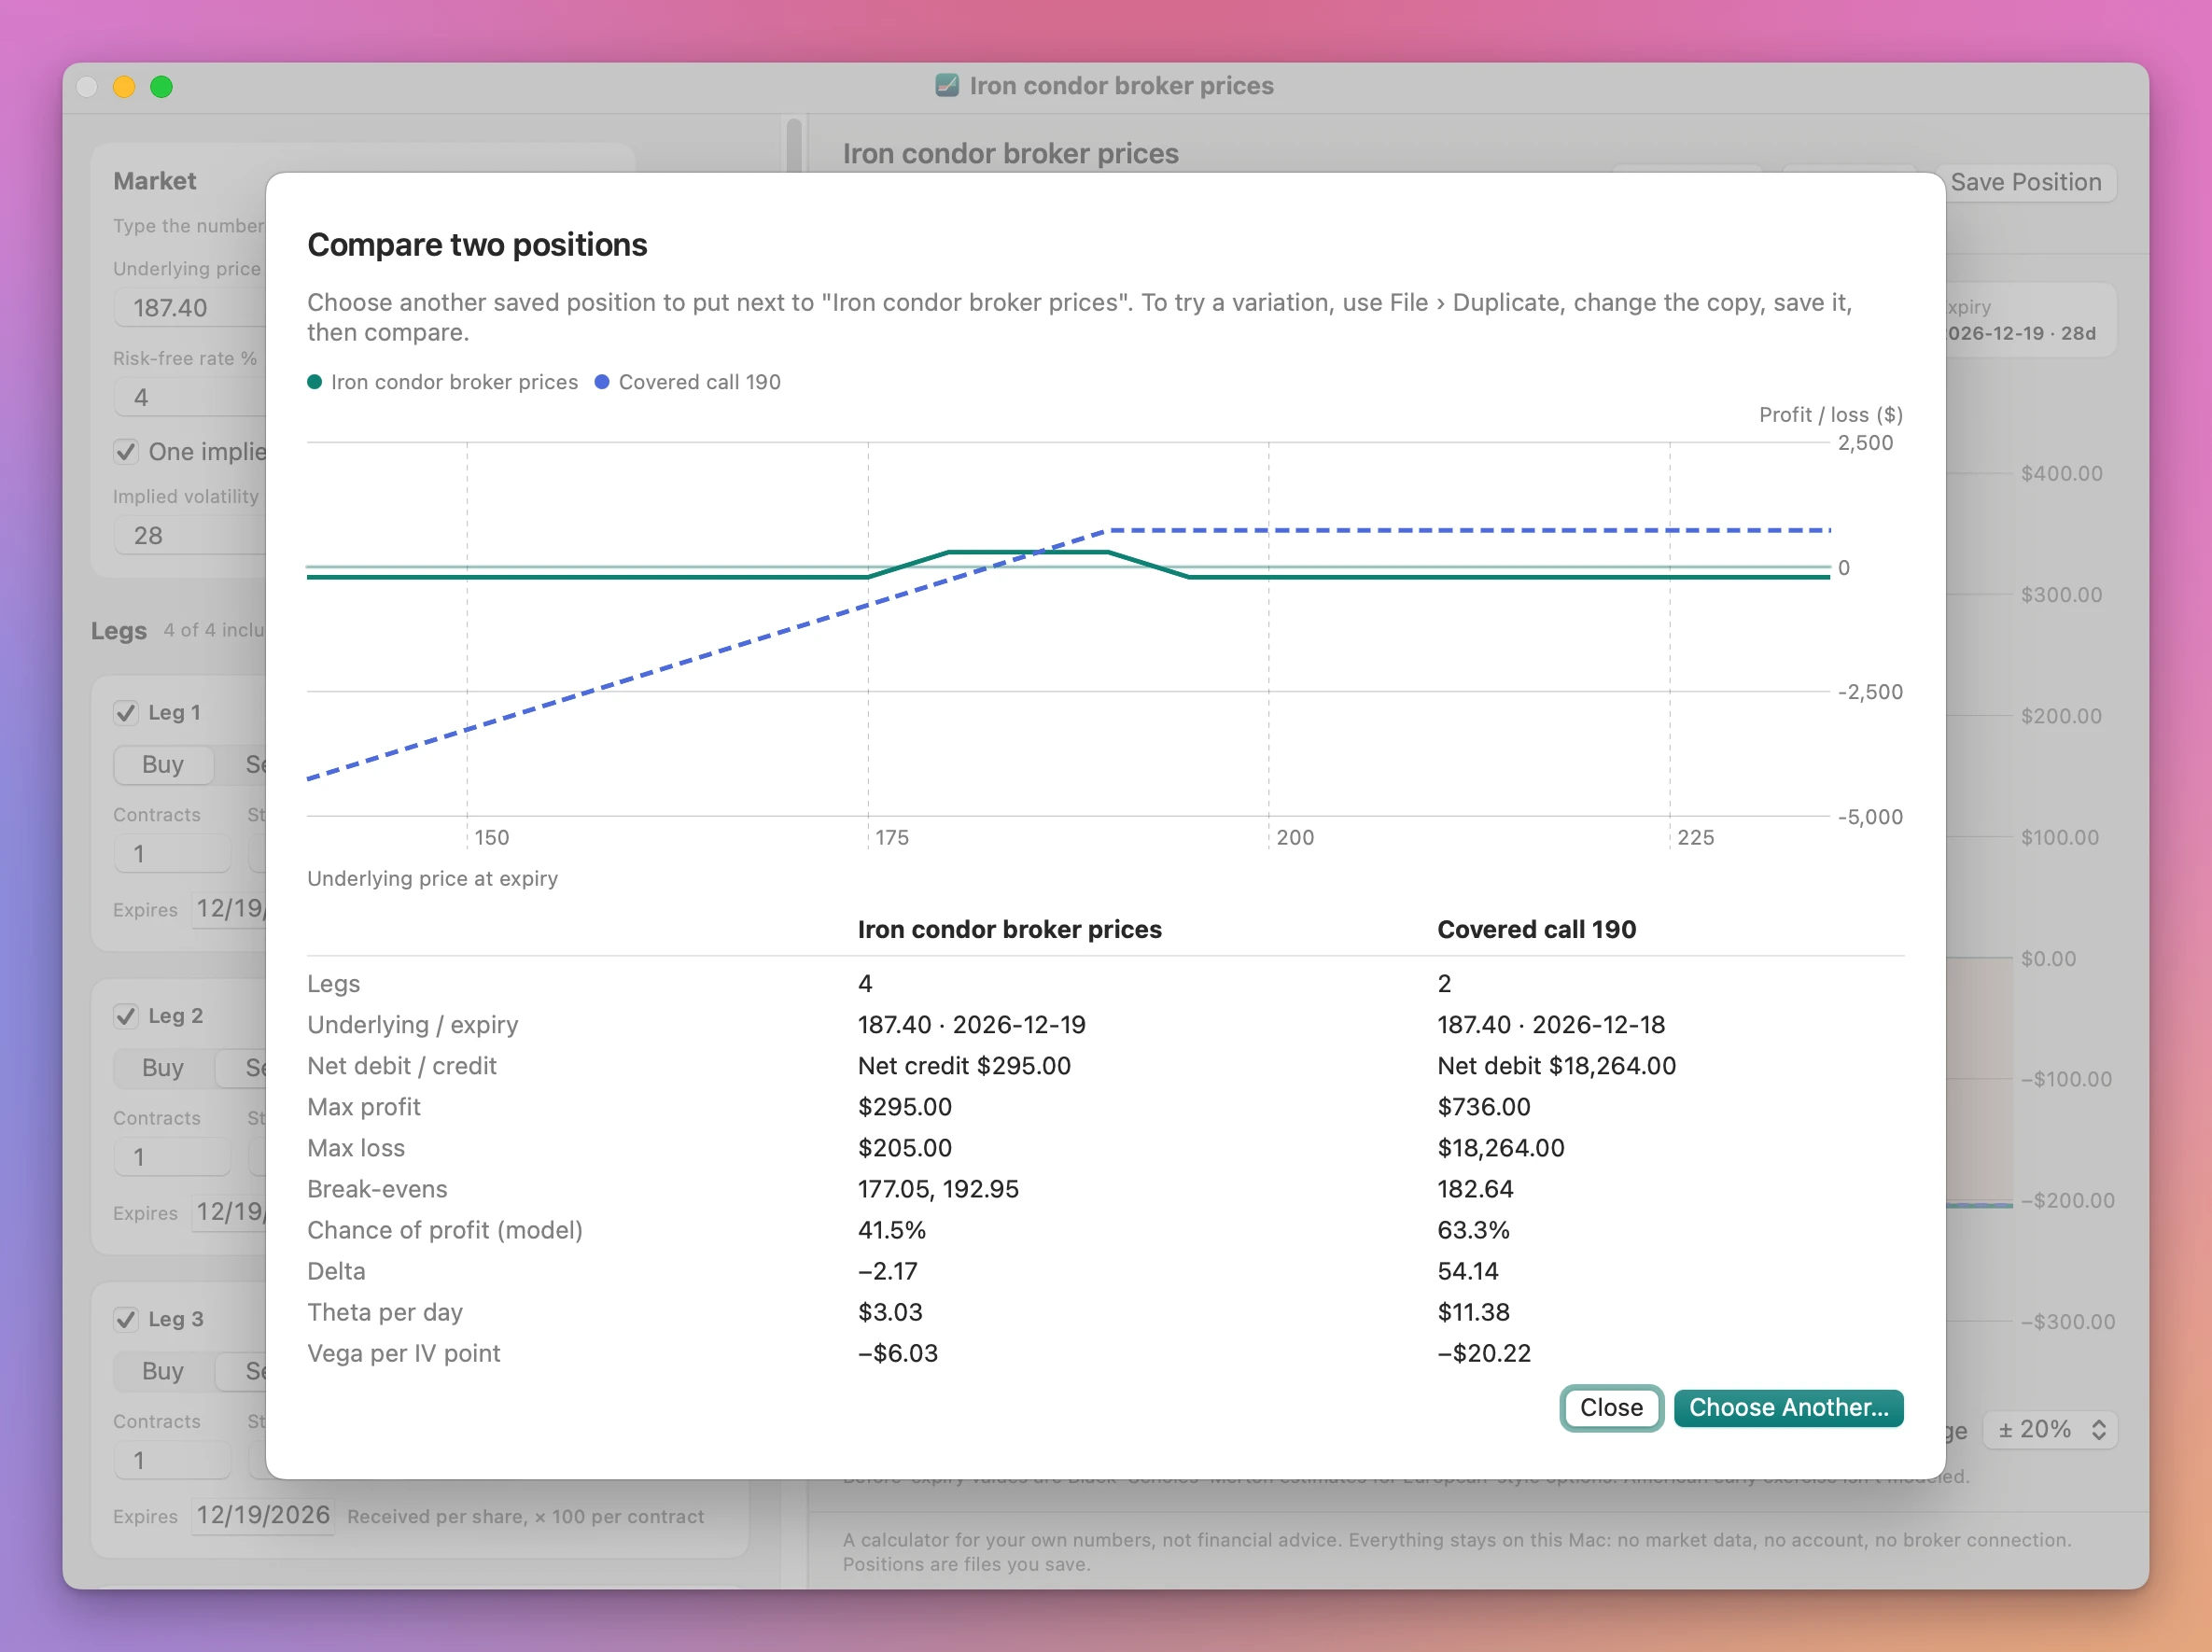
Compare… (Shift-Command-K) picks another saved position and draws both expiry lines on one chart. Under it, a table puts them next to each other: legs, underlying and expiry, net debit or credit, max profit, max loss, break-evens, chance of profit, delta, theta and vega.
Problems in plain sentences
If a leg can’t be read, the right side says “The chart needs a few fixes” and lists what to change, and the leg card turns red with the same sentence. A negative premium, an expiry before today, or legs with different expiries each get a sentence that says how to fix it. A missing implied volatility hides only the estimate, the Greeks and the odds: the expiry numbers don’t need it.
Uncheck a leg’s checkbox to leave it out without deleting it. If that leaves more calls sold than bought, Max loss reads “Unlimited” and a red line says why.
Why not use a spreadsheet, a free website or your broker
macOS has nothing for this. In Numbers or Excel the payoff at expiry is a MAX formula per leg, and that part is fine. Then you need the break-evens, max profit and max loss, which means finding where the line crosses zero and checking every strike. Anything before expiry needs Black–Scholes written out with NORM.S.DIST for each leg, and the Greeks are more of the same.
Free web calculators do this math, including the well-known optionsprofitcalculator.com. They’re free and ad-supported. You type or look up the position on their page each time, and your positions live on their site, not in a file you keep.
Broker platforms like thinkorswim, Tastytrade and Interactive Brokers draw good payoff graphs, with live option chains, which this app doesn’t have. You have to log in, and they’re built around the positions you hold or are about to send as an order.
| Spreadsheet | Free web calculator | Broker platform | Options Profit Calculator | |
|---|---|---|---|---|
| Cost | Free | Free, with ads | Free with the account | $19 once |
| Payoff at expiry | Formulas per leg | Yes | Yes | Yes |
| Estimate before expiry | Black–Scholes by hand | Yes | Yes | Yes, Black–Scholes–Merton |
| Live prices and option chains | No | Some | Yes | No, you type the prices |
| American exercise, volatility skew | No | Varies | Yes | No |
| Works offline, no login | Yes | No | No | Yes |
| Positions saved as files | Your workbook | On their site | In the account | Yes |
| Compare two positions | If you build it | Varies | Varies | Compare… |
| Chart PNG and CSV export | Partly | Varies | Varies | Yes |
What it doesn’t do
- It doesn’t fetch prices or option chains. You type the underlying price, the premiums and the implied volatility.
- It doesn’t connect to a broker or place orders.
- It doesn’t do calendar or diagonal spreads. Every option leg in a position shares one expiry.
- It doesn’t model American early exercise, discrete dividends or volatility skew. One implied volatility for all legs, or one per leg, and a continuous dividend yield.
- It doesn’t account for commissions, fees or assignment.
- It’s for US-style contracts. 100 shares per contract, amounts in dollars.
- It doesn’t tell you what to trade. It works out the numbers for the position you type.
Questions
Is this financial advice?
No. It’s a calculator for your own numbers. The strategy cards are templates to start from, and their premiums come from the model, so replace them with the prices you were quoted.
How accurate is the before-expiry estimate?
It’s the Black–Scholes–Merton value of each leg with the volatility and rate you typed, for European-style options. The pricing is checked against published textbook examples. Real option prices also reflect skew, early exercise and the market’s mood, so treat the dashed line as an estimate. The expiry line is exact.
What does chance of profit mean here?
The model’s probability that the position is profitable at expiry, if the price follows a lognormal distribution with the volatility you typed. When legs have different volatilities, it uses their average. It’s an estimate, not a forecast.
Does anything get uploaded?
No. Positions are files on your Mac. The app uses the internet only to check for and download updates.
Can I use the chart in a post or a class?
Yes. Export › Chart as PNG… saves a 2400×1440 PNG with the legs, the numbers and the model note, on a light background.
What it needs
Options Profit Calculator runs on macOS 14 Sonoma or later, on Apple silicon and Intel Macs.
The Options Profit Calculator docs walk through every field and view.
Buy Options Profit Calculator
$19 plus tax where it applies, paid once.
Download the app from the order page or your Creem receipt, unzip it and move it to Applications. I sign the app with my Apple Developer ID, and Apple notarizes the download.
The app checks for updates once a day. When a new version is ready, click Install and Relaunch. To check anytime, choose Options Profit Calculator → Check for Updates….